Evidence

Evidence & results

Dataset provenance, patient-wise testing, literature and current results status.

Three answers before the detail

What helped. Adding ECG, EMG and motion to EEG cut false alarms from 0.86 to 0.04 a day at the same sensitivity, on 29 patients the model had never seen. That was the project’s primary hypothesis, hashed before the test was opened, and it held on every bootstrap sample.

Under what control. Patient-wise development folds, then one run of a locked internal test that is now spent. The threshold, the features and the analysis script were frozen and hashed before the locked patients were downloaded.

What it still cannot show. Performance on anyone outside SeizeIT2, since the two external evaluations have not been run; any on-device result; or prediction before a seizure. These results are for detection. And one of our own development findings — that the brain signal changes first — did not replicate on the locked patients.

Training data and held-out evaluation

SeizeIT2 is the only training set: the only public dataset with EEG, ECG and EMG recorded simultaneously from one wearable, in the two-channel behind-the-ear setting our hardware targets. Everything else is a test the model never sees during training, opened once after a hashed pre-registration, the way a landslide model trained on one continent is tested on another.

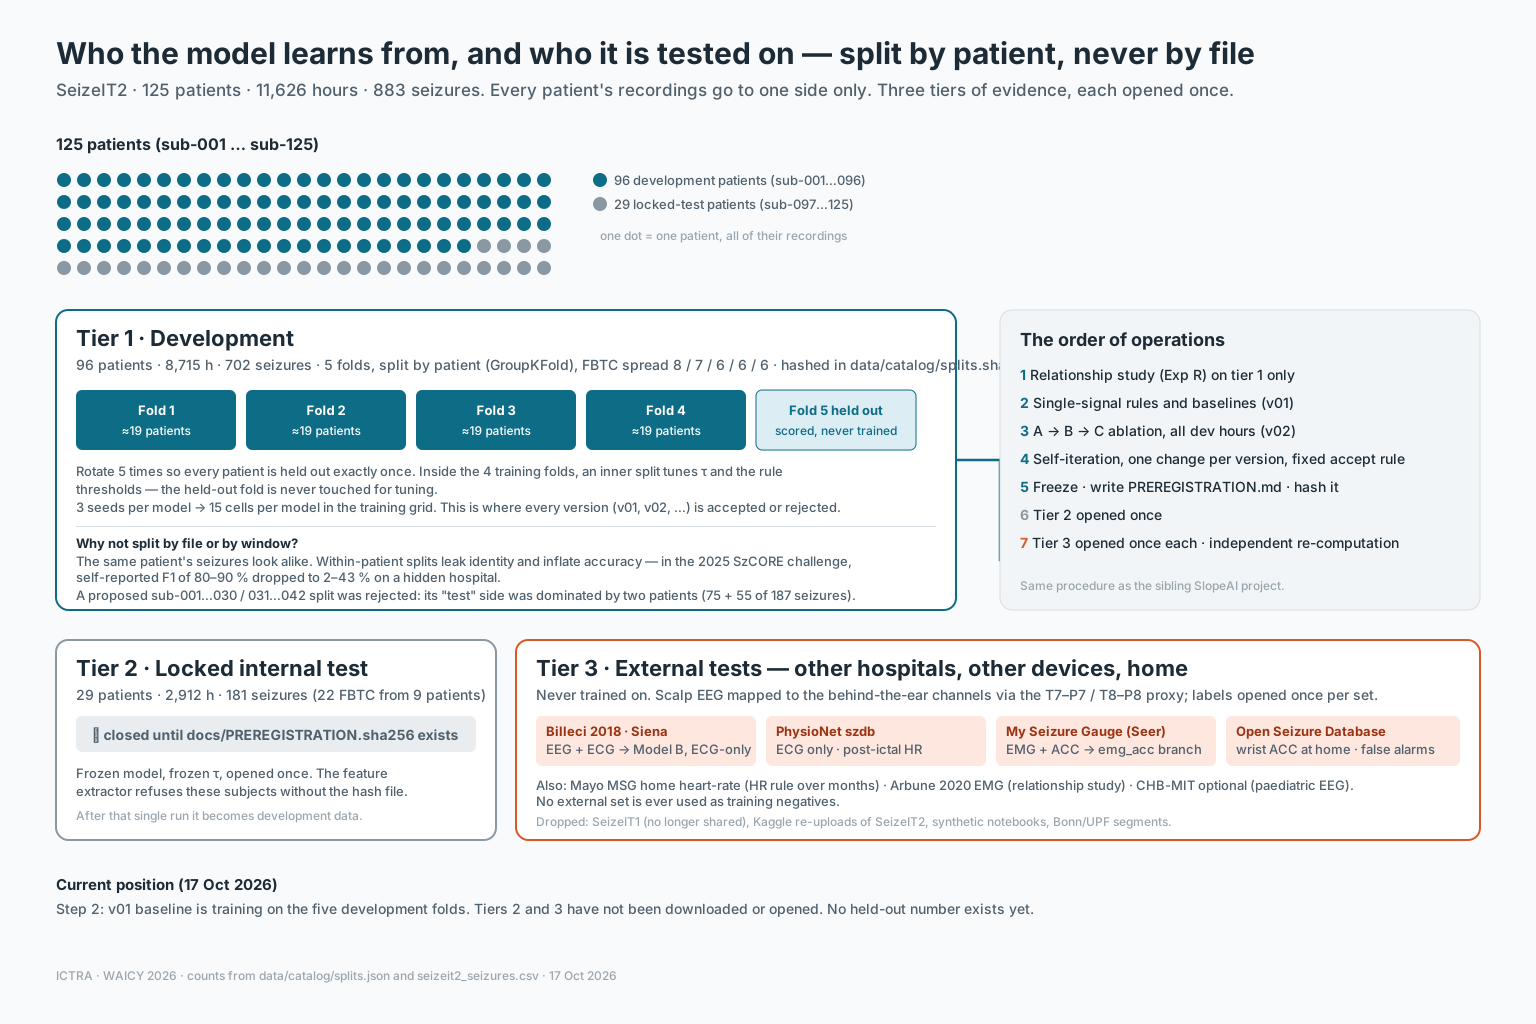
A grid of 125 person icons. 96 are highlighted as development patients; 29 are greyed out as the locked test set.
The 29 we looked at once. Almost every number on this site comes from the 96 highlighted patients. The 29 others were the locked test set: untouched from day one, opened on 28 October 2026 after the pre-registration was published with a hash, scored once, whatever it said. What it said →
The pre-registration, and exactly what its timestamp proves

Before the locked recordings were downloaded we wrote down what we would test and how we would judge it, and took a SHA-256 of that document:

bc5048c88ae3524348215e4c62801ec66fedbe5c4e4ac616bcbb3c3944fedca6

The document and its hash are public in our research repository, in this commit, alongside a second commit holding a SHA-256 of all 778 annotation files in the locked set, recorded the moment they arrived.

What the public timestamp proves. The repository was pushed on 28 October 2026 at 04:07 UTC. That is before any locked-set feature was extracted and before the test was run, so the rules could not have been written to fit a result we had already seen.

What it does not prove. It does not prove the hash existed before the locked recordings were downloaded, which happened earlier the same day. The commit dates say 26 October, but a local commit date is set by the machine that made it. The strongest supporting evidence we can offer is the repository history: the pre-registration draft, and the hypotheses changing as our own measurements came in, run back to 17 October. We would rather state the limit than let someone find it.

The research repository →

125 SeizeIT2 patients are separated into 96 development patients and 29 locked-test patients. Patient-wise cross-validation precedes model and threshold freezing and a single held-out evaluation.
Schematic drawn from the pipeline code. 96 development patients; 29 locked-test patients. The fold blocks illustrate patient separation, not exact fold sizes. Test data do not enter model selection. Evaluation remains pending. View full-size diagram ↗ · Image provenance
SeizeIT2 · 883 annotated seizures by type

Mostly focal seizures, the kind smartwatches miss

125 patients · 11,626 hours · five European epilepsy centres · 2020–2022 · counts recomputed from every released annotation file

Only 55 convulsive seizures, from 37 patients. That is the kind a smartwatch can catch, and the kind we expect every signal to see; the other 828 are where fusion has to earn its place. Bhagubai et al. 2025; our catalog of the released files. dataset ↗
Three tiers of evidence, each stronger than the last

Develop on 96 patients, test once on 29, then on other hospitals' data

1 · sub-001 … 096 · 5 folds by patient 2 · 097–125 DEVELOPMENT · 96 patients · 8,715 h · 702 seizures LOCKED · 29 · 2,912 h · 181 sz 3 · external: Billeci · Siena · szdb · My Seizure Gauge · Open Seizure Database NEVER TRAINED ON · other hospitals, other devices, home recordings Tiers 2 and 3 stay closed until docs/PREREGISTRATION.md is written and hashed; each is opened once. Scoring is event-level (SzCORE): sensitivity, false alarms per 24 h, delay, with patient-bootstrap intervals. All published numbers are offline evaluations (zero-phase filters); a causal pipeline is a tracked version.
Why so strict: in the 2025 SzCORE challenge, teams' self-reported F1 scores of 80–90% fell to 2–43% on a hidden hospital dataset. In-dataset cross-validation is not evidence. SzCORE ↗
Full dataset inventory and access links
DatasetSignalsSizeRole in ICTRAAccess
SeizeIT2 (KU Leuven, 2025)EEG ECG EMG ACC/GYR125 patients · 11,626 h · 883 seizuresTraining (sub-001–096) and the locked test (sub-097–125)OpenNeuro · CC0
Billeci et al. (Siena, 2018)EEG scalp ECG 512 Hz15 patients · 38 seizuresExternal test for Models A and B via a T7–P7 / T8–P8 behind-the-ear proxyZenodo · CC BY-SA
Siena Scalp EEG (2020)EEG scalp ECG 512 Hz14 adults · 47 seizures · ~128 hExternal test for Models A and B (same hospital as Billeci; overlap checked first)PhysioNet
PhysioNet szdbECG 200 Hz5 patients · 11 seizuresSanity test for the heart-rate branchPhysioNet
My Seizure Gauge (Seer)EMG ACC Sensor Dot · E410 patients · 3–5 days eachExternal test for the EMG + motion branch, same sensor family as SeizeIT2Registration
Open Seizure Databasewrist ACC + HR49 users · 146 seizures · 348 labelled false alarms · at homeReal-world false-alarm benchmark for the motion branchOn request
Arbune et al. 2020 (Zenodo)EMG deltoid + biceps EEG42 patients · convulsive seizures · 794 MBSecond relationship study: does ictal muscle activity predict the post-seizure EEG suppression linked to SUDEP?Zenodo · open
CHB-MIT (2009)EEG 23 ch, 256 Hz22 children · 198 seizuresOptional paediatric EEG-only check (Model A)PhysioNet
Not usedHealthy-volunteer EEG sets (EEGMMIDB, ds005505), Bonn / UCI segments, Kaggle re-uploads of SeizeIT2. A model given "healthy" recordings from a different device learns which recorder made the clip, not whether a seizure is present. Negatives come from SeizeIT2's own 10,000+ seizure-free hours.—

Our own BioSignal Studio recordings (consenting healthy volunteers: chewing, walking, stairs, typing, sleep posture) are used for the live demo and for counting false alarms on our own board, never for the reported detection numbers. Data audit notes, the dataset inventory with every keep-or-drop decision, and the patient-wise split with its hash are in the project repository.

Reading the experiments behind the results

Two actual ICTRA Lab screens: one explores how signals change around a seizure; the other compares trained models against single-signal rules. They answer different questions.

Real dashboard captures · 18 October 2026, 06:47–06:49 UTC · static, not live. Downloads, split & training record · Capture record

Do the signals change together?

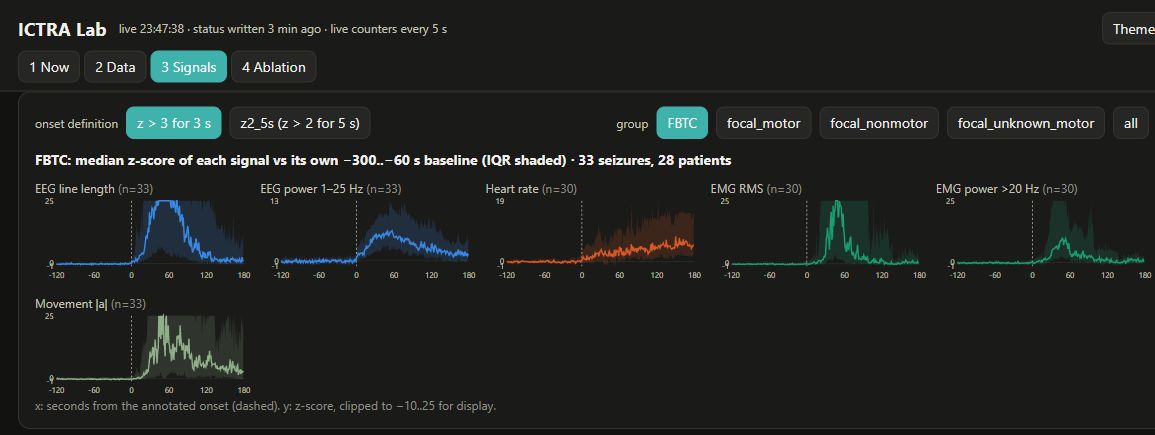
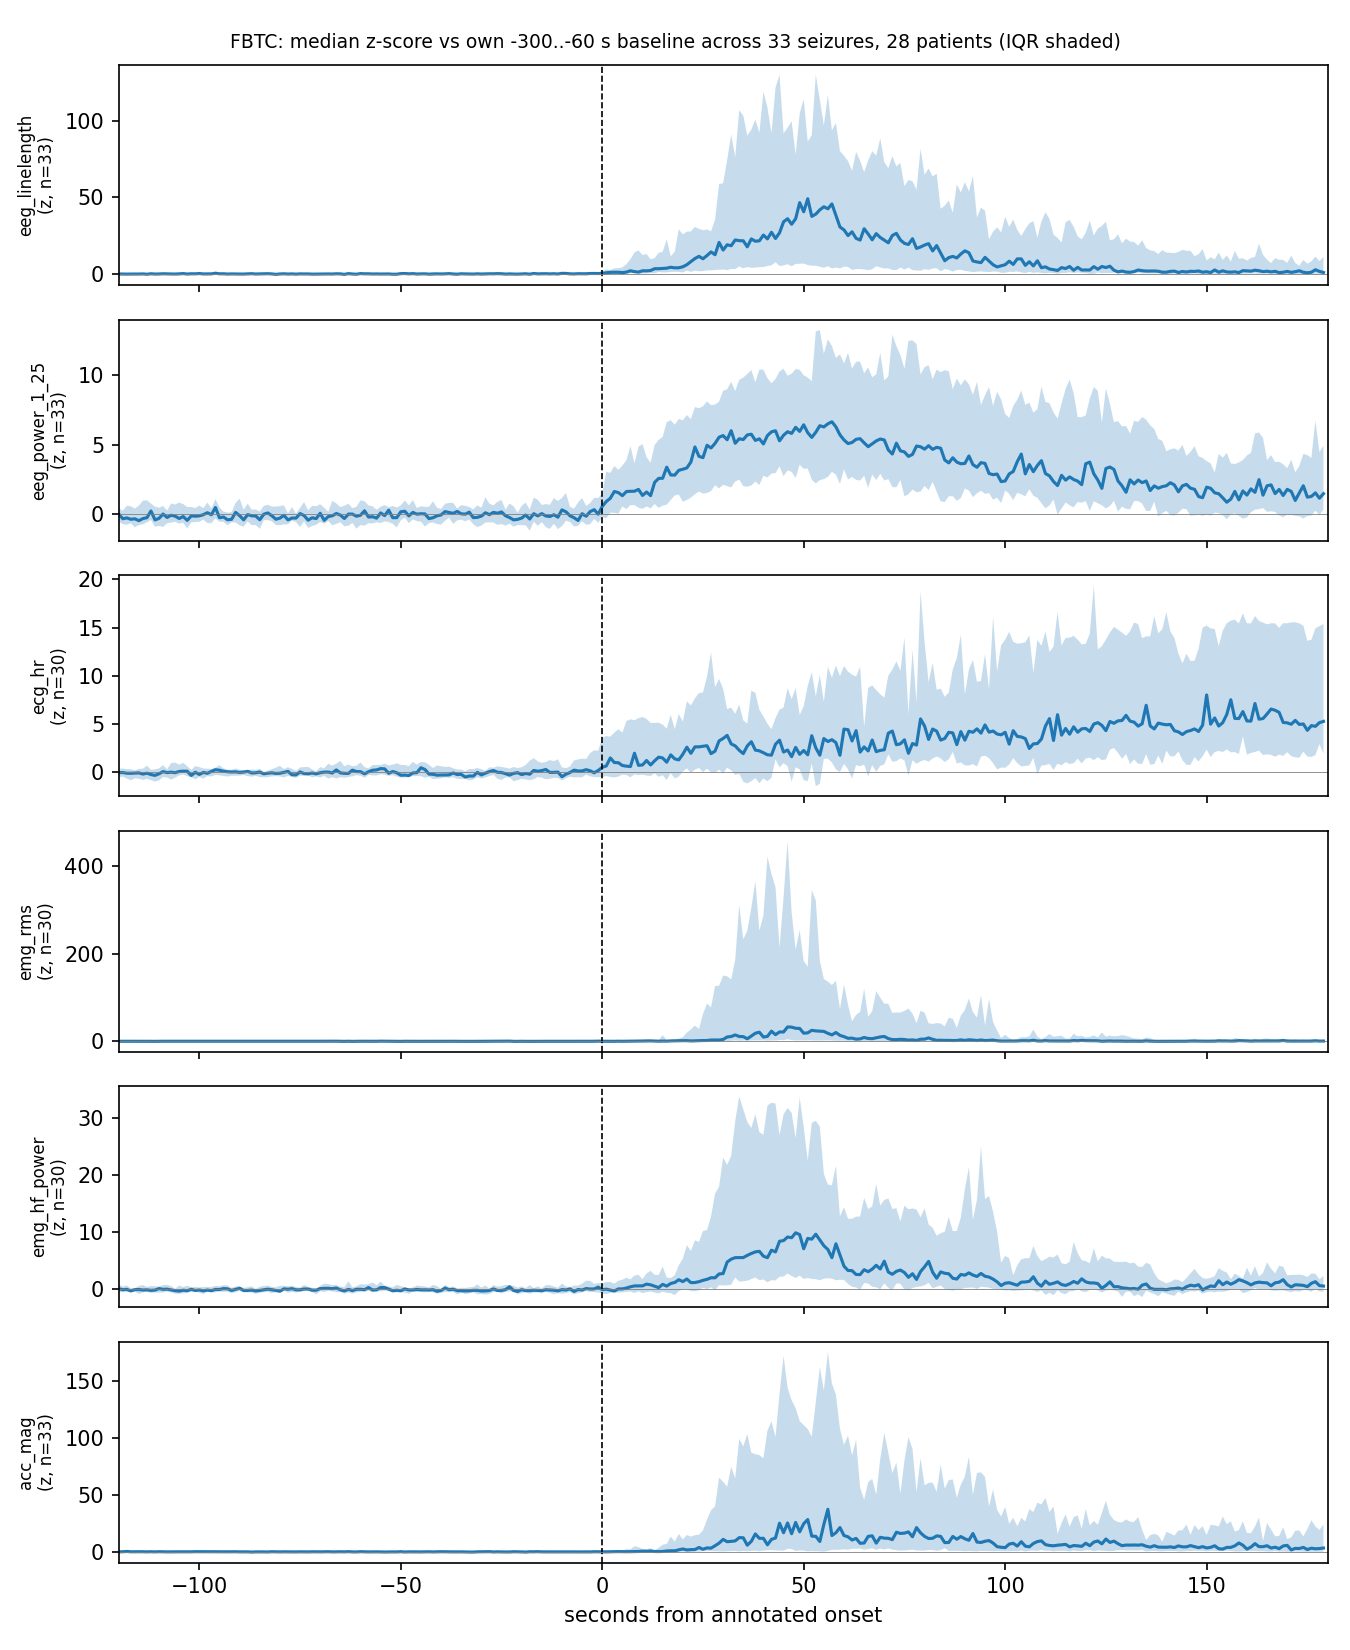
Real Signals tab showing six normalized feature curves around annotated focal-to-bilateral tonic-clonic seizure onset, based on 33 seizures from 28 development patients

This view selects FBTC (focal-to-bilateral tonic-clonic seizures): 33 seizures from 28 patients. The six panels show EEG line length and power, heart rate, two EMG features and movement. Each curve is a median feature z-score relative to its own −300 to −60 second baseline; shading is the interquartile range.

The dashed line is the annotated onset, not an AI alarm. These are aggregated features, not a raw patient trace or a detection-accuracy chart. ECG/EMG panels contain 30 events, not 33. The vertical display is clipped to −10…25. This offline, onset-aligned analysis does not establish prospective prediction or real-time latency.

What does each added signal earn?

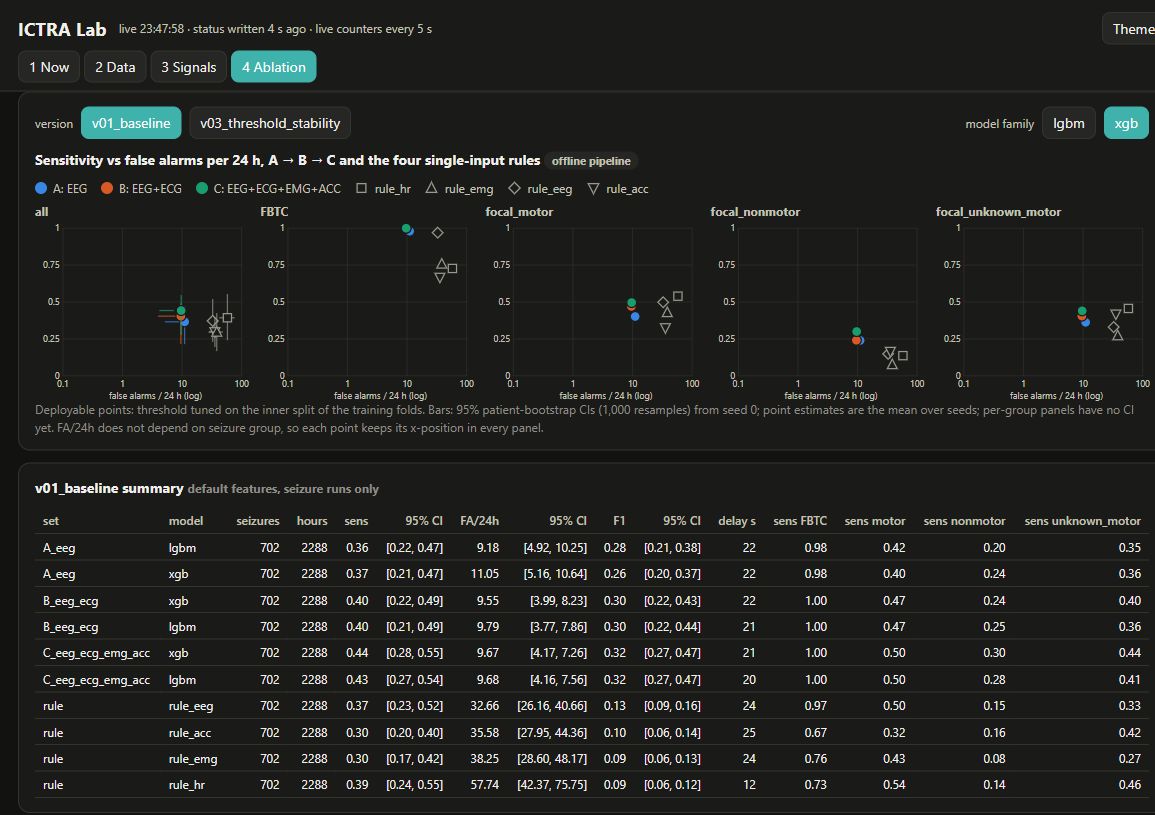
Real Ablation tab with v01_baseline and XGBoost selected: sensitivity versus false alarms per day for Models A, B and C, single-signal rules, and the baseline summary table

v01_baseline · XGBoost selected. A uses EEG; B adds ECG; C adds EMG and movement. The separate markers are single-input rules. Up means higher sensitivity; left means fewer false alarms per 24 hours, on a logarithmic scale. The panels separate all seizures from individual seizure groups.

Scope: 702 seizures, 2,288 hours of seizure-containing development recordings. These points use thresholds selected on the inner training split. Point estimates average seeds; the overall-panel 95% patient-bootstrap intervals shown are from seed 0. A finished plot is not a locked-test result, and this hour base cannot establish all-day home false-alarm burden. Read the full baseline results and caveats →

Results status

The locked internal test was opened once on 28 October 2026 and is reported first below, with the hypothesis that failed and the finding that did not replicate. Everything after it is development work, labelled as such. Two external evaluations remain untouched. Every number on this page is re-derivable from the published per-second predictions.

How to read our numbers (plain language)
Sensitivity
Of all seizures that happened, the share the system flagged. 0.44 = 44 seizures in 100 caught.
FA / 24 h
False alarms per day of wearing: alarms with no seizure behind them. A watch that cries wolf ten times a day gets taken off.
Event F1
One number that balances the two: high when most seizures are caught and most alarms are real. 0.32 means neither side is good yet; the SzCORE 2025 winner scored 0.32 on scalp EEG.
Threshold τ
The alarm line. The model outputs a probability every 2 s; an alarm fires when 3 of the last 5 values exceed τ. Raise τ: fewer false alarms, fewer seizures caught. Lower it: the reverse. Every version sits somewhere on this curve.
Fixed FA budget
"At no more than 2 false alarms a day, how many seizures do you catch?" The only fair way to compare two versions or two devices.
FBTC
Focal-to-bilateral tonic-clonic: the convulsive seizure, the type linked to SUDEP. ICTRA catches 0.97–1.00 of them in every version so far.
Accepted / rejected
Not our opinion. A rule fixed before training decides; v03 is the first version it turned down.

The locked internal test — opened once, 28 October 2026 Constance · evaluation

29 patients (sub-097…125), 2,906 unmasked hours, 181 seizures — the same split the SeizeIT2 data descriptor itself suggests, so it is not a division we picked to flatter ourselves. No model, threshold, feature or analysis choice had ever seen them. 07_locked_test.py ran once, twelve seconds after the pre-registration commit was pushed, and will not be run again — a second run would have to be disclosed, and a disclosed re-run is worth less than the first number. From here on these 29 patients are development data. Source: results/locked_test/RESULTS.md.

Model C, four signals, at the frozen threshold

Both columns use the pre-registered primary aggregation: each metric computed per patient, then averaged over patients. Brackets are patient-bootstrap 95 % intervals. The offline (v02g) lineage.

development
96 patients, 702 seizures
locked test
29 patients, 181 seizures
sensitivity0.4020.331 [0.197, 0.480]
false alarms / 24 h1.470.23 [0.06, 0.48]
precision0.4160.657
event F10.2920.337 [0.205, 0.477]
median alarm delay—39 s
all seizures pooled, not per patient0.268 sens · 1.31 FA · 0.280 F10.160 sens · 0.15 FA · 0.254 F1

What fell, and what did not. Sensitivity dropped by seven points, from 0.402 to 0.331. Event F1 went up, because the false-alarm rate fell further than sensitivity did. That shape — fewer seizures caught, far fewer false alarms — is what a more conservative operating point looks like, and the two columns are not a clean generalization gap: development numbers come from five fold models each with its own threshold, averaged over fifteen repeats, while the locked column is one three-seed ensemble at one frozen threshold. Different procedures on different patients. We report them side by side because that is the comparison the pre-registration asked for, not because the difference between them has a single cause.

The four pre-registered hypotheses

Decided exactly as written in the pre-registration: all seizures of the locked set, per-patient averages, and P ≥ 0.90 on the patient bootstrap for H1, H2 and H4.

hypothesisoutcomeestimate [95 % CI]
H1 · Four signals cut false alarms at the same sensitivityheld0.04 vs 0.86 a day; Δ −0.82 [−1.29, −0.36], P = 1.000
H2 · Adding ECG helps most on seizures without movementnot held+0.083 sensitivity [+0.000, +0.200]; P = 0.881, under the 0.90 bar
H3b · Adding ECG catches more focal seizures without delaying the alarmheld−1.5 s delay, +0.102 sensitivity [+0.024, +0.192]
H4 · A learned model beats every single-signal ruleheld+0.161 / +0.260 / +0.282 event F1 for models A / B / C; all P = 1.000

H2 is the one that did not hold. The direction was right and the effect was the size we expected; the bootstrap put the probability of improvement at 0.881, and our rule said 0.90. We are not going to round it. Seizures without movement remain the hardest case and the one we are least able to claim.

A finding of our own that did not replicate. On the development set we measured that the brain signal changes before the heart, before movement and before muscle — the timing argument that motivated putting EEG at the centre of the design. On the locked patients it did not hold: the brain signal led heart rate by −1.0 s (interval −15 to +6 s, 21 seizures), which is to say heart rate moved first, at the median. Movement and muscle still followed the brain. H3a is recorded as not held. The case for ear-EEG on this page now rests on the information it carries, which H4 and H1 both support, and not on it arriving first.

What making the model real-time costs. The causal lineage (v11) never looks forward in time. On the development set that cost 0.011 event F1, an interval that includes zero. On the locked patients it cost 0.073 [−0.135, −0.017] — an interval that does not include zero. Both numbers are from the same comparison, on different patients, and we publish both rather than the kinder one. The causal model is the one that could be worn; the offline model is the one that should be compared with published offline work.

Where it still misses. On the locked patients, model C caught 77 % of convulsive seizures (per patient; 18 of 22 counted directly), 32 % of focal seizures with movement, 17 % of focal seizures without movement, and none of the 30 seizures whose motor status was unrecorded. No seizure shorter than 15 seconds was caught, in any model. A third of a patient's seizures, found without a hospital bed, is a result worth having; it is not a monitor, and the page on ethics and limitations says what follows from that.

Exhibit 1 · Three signals, one seizure (delivered 17 Oct 2026) Carina · ECG branch Tiffany · EMG + motion

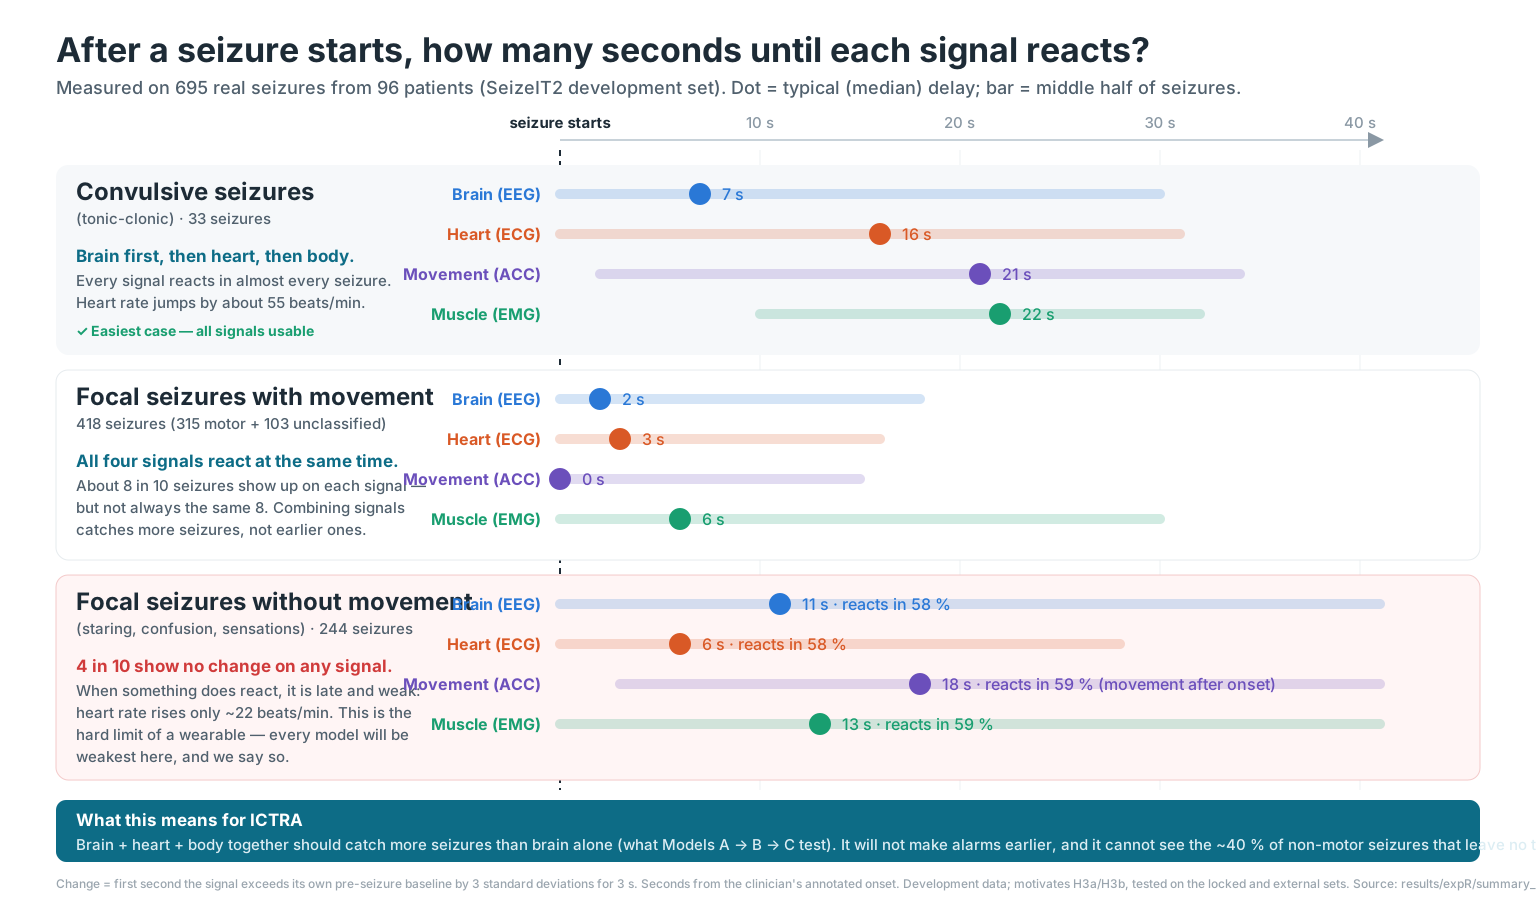
Relationship study (Exp R) on the 96 development patients, 695 seizures ≥ 5 s. Development data only: these numbers motivated hypotheses H3a/H3b and cannot confirm them. They were tested on the locked set on 28 October 2026: H3b held, H3a did not — there the heart moved first, at the median. What the locked test found →

Timeline per seizure type showing the median change time of EEG, heart rate, EMG and accelerometer after the annotated onset, with IQR bars: FBTC EEG first then HR, ACC, EMG; focal motor all simultaneous; focal non-motor about 40 percent with no change on any signal.
Read it row by row: each dot is how many seconds after the seizure starts that signal typically reacts. In convulsive seizures the brain reacts first and the body about 15 s later. In focal seizures with movement all four react together, so adding signals catches more seizures rather than earlier ones. In focal seizures without movement, 4 in 10 leave no trace on any signal — the limit every model will show.
Technical figures: the full signal curves for each seizure type (6 signals × 4 groups)
Median z-score curves of EEG line length, EEG power, heart rate, EMG RMS, EMG high-frequency power and accelerometer magnitude around FBTC seizure onset, 33 seizures
FBTC · 33 seizures: every signal rises; EMG and ACC peak at z ≈ 30–40 around +50 s.
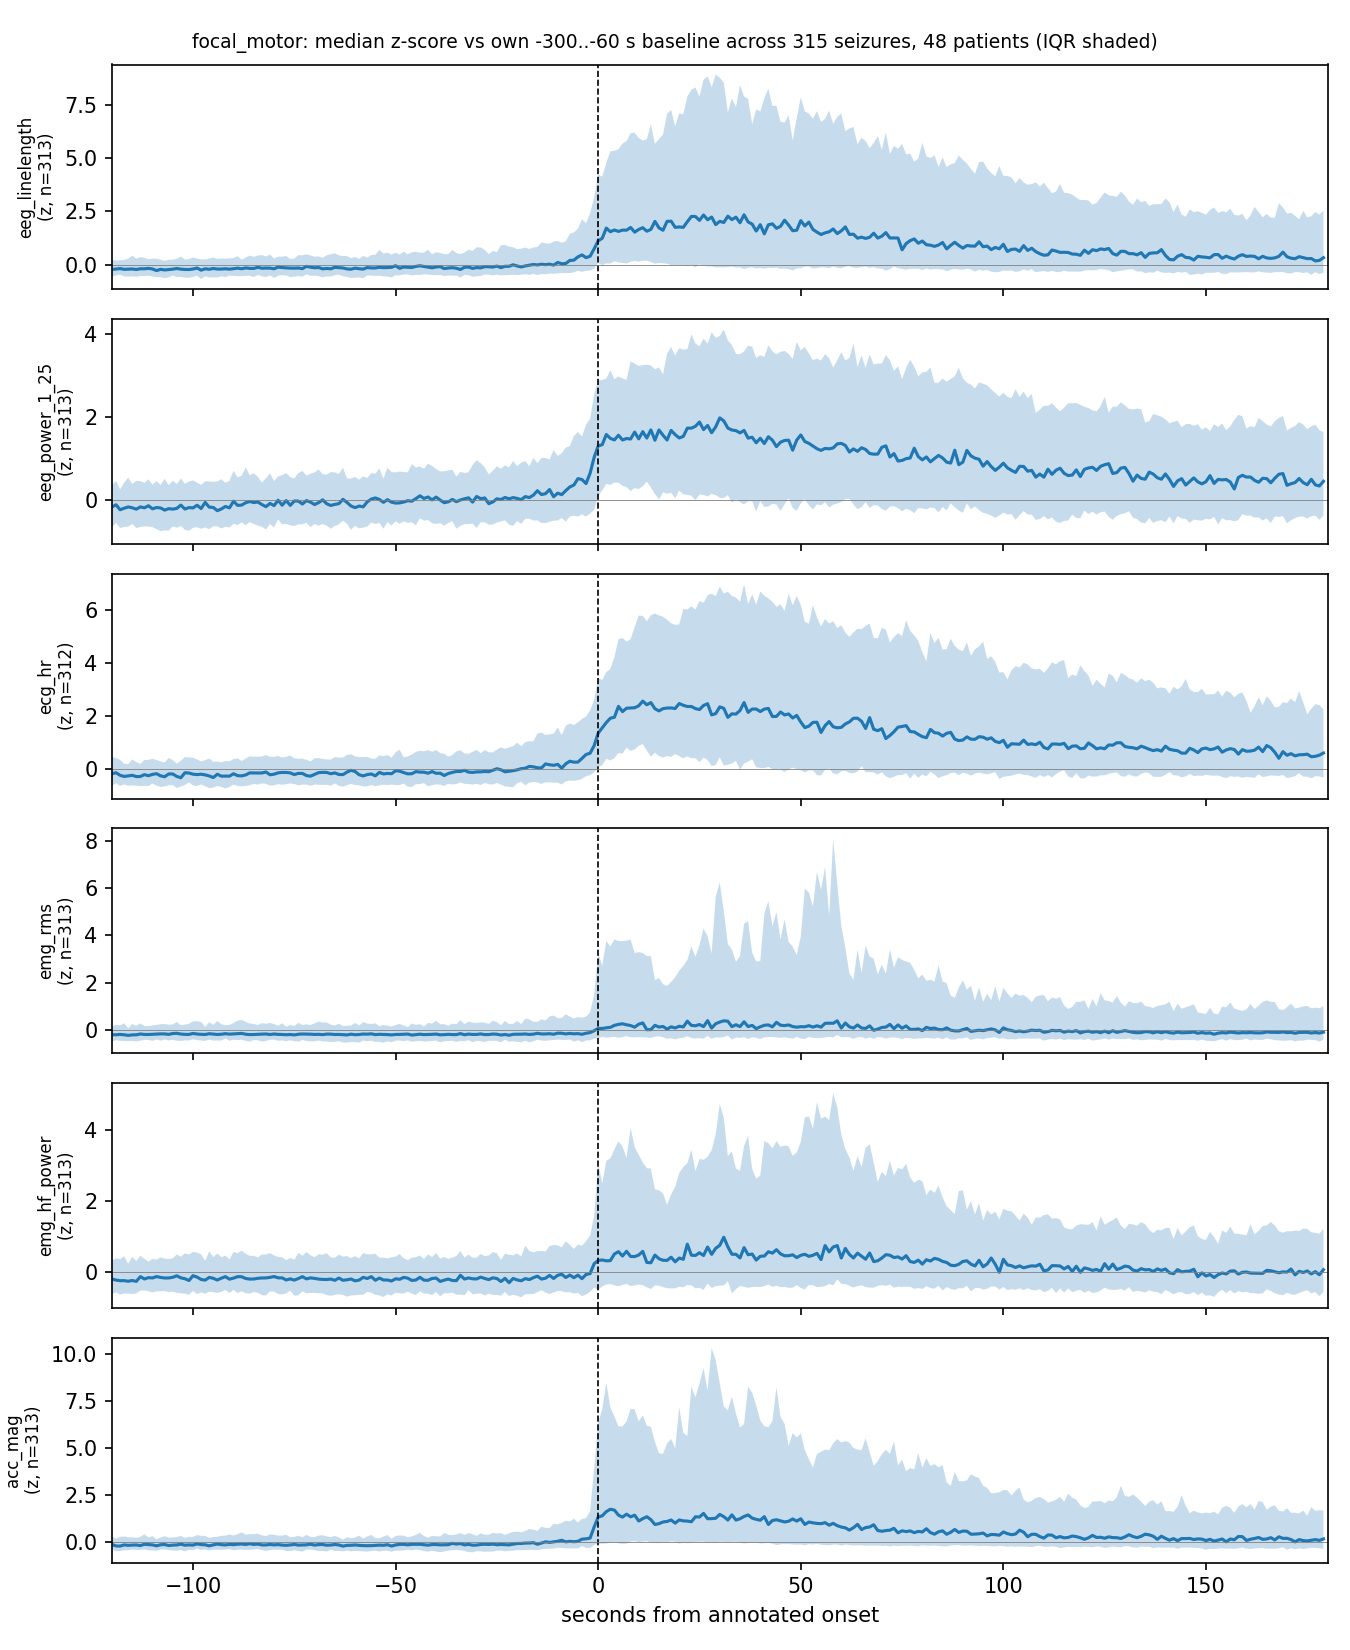
Median z-score curves around focal motor seizure onset, 315 seizures
Focal motor · 315 seizures: all signals change within seconds of onset.
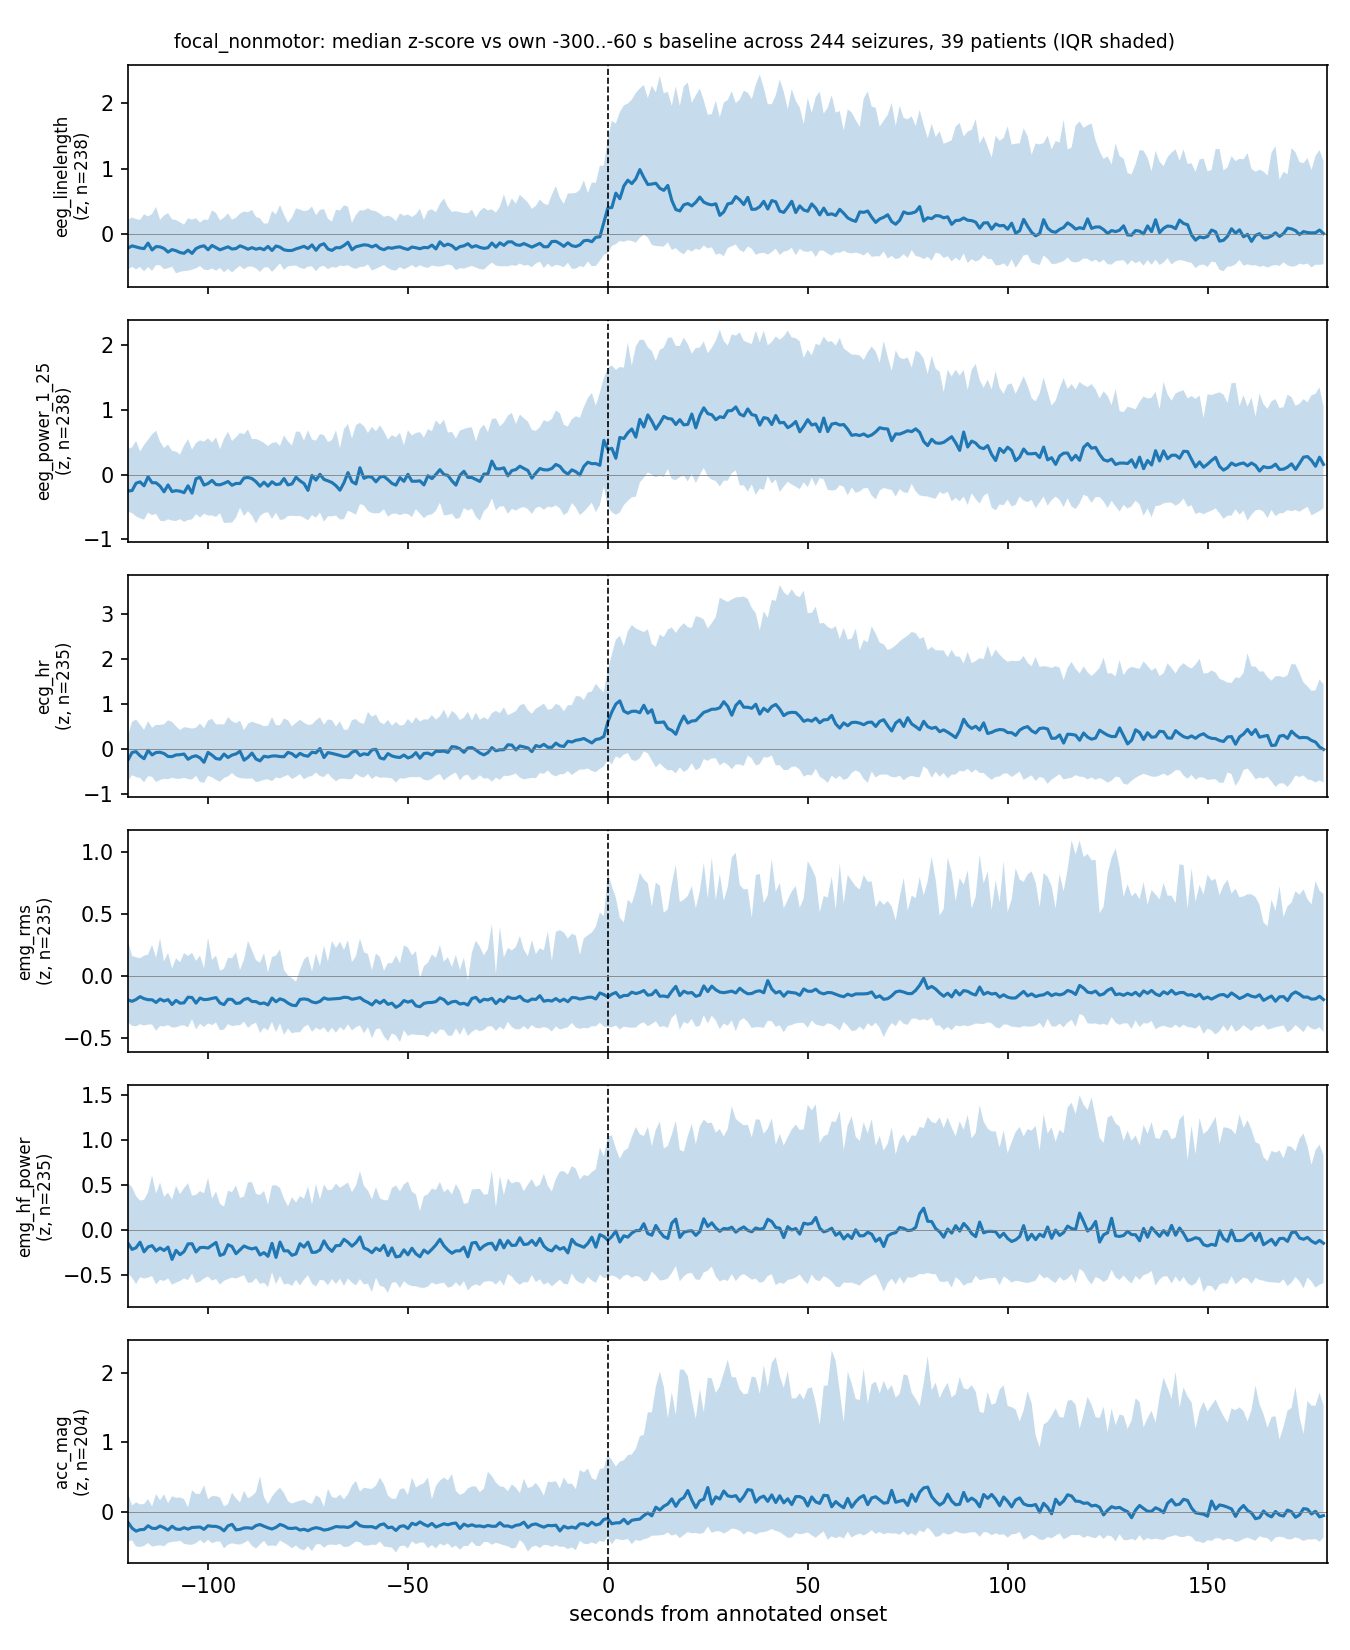
Median z-score curves around focal non-motor seizure onset, 244 seizures
Focal non-motor · 244 seizures: small, late, spread-out changes; the smallest heart-rate rise (22 bpm).
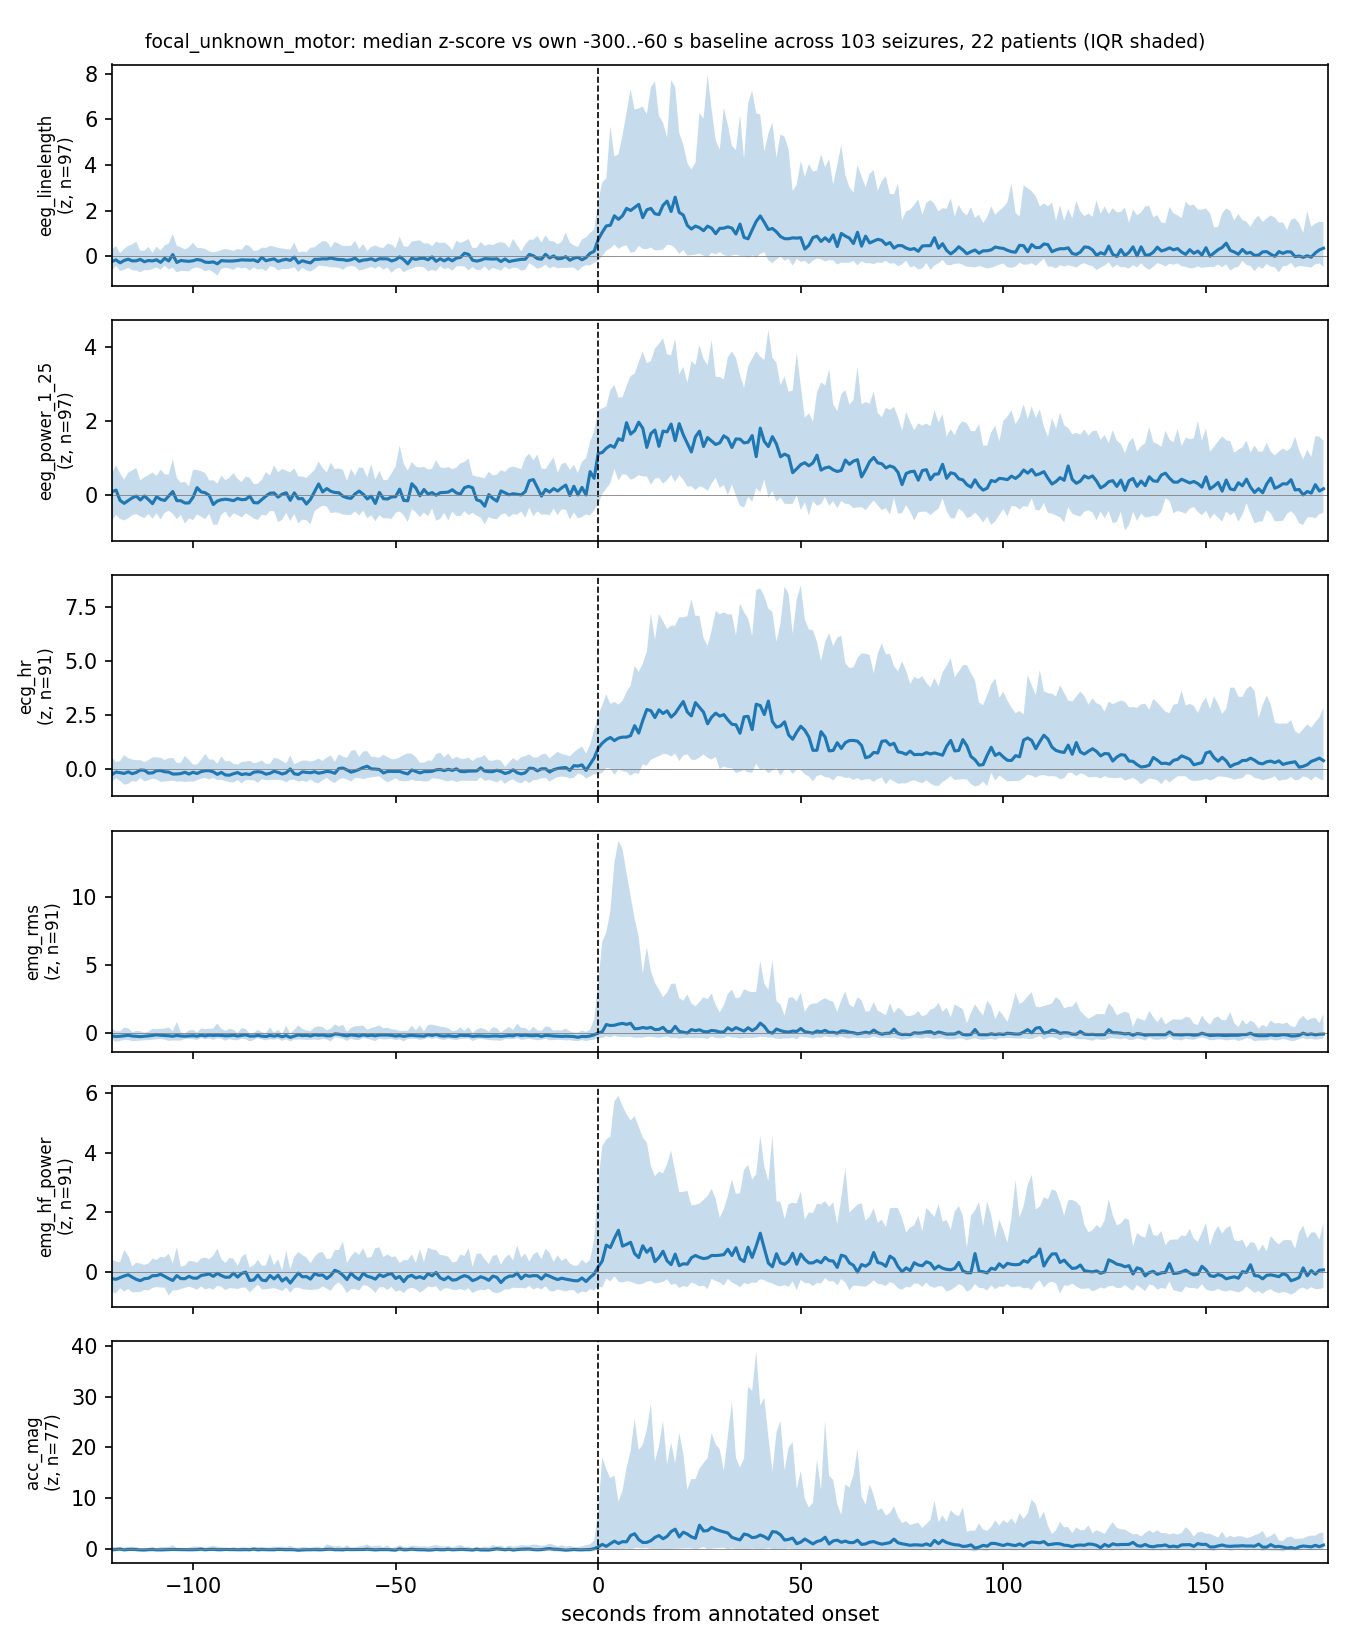
Median z-score curves around focal seizures of unknown motor status, 103 seizures
Unknown motor status · 103 seizures: behaves like focal motor.

Median z-score against each seizure's own −300…−60 s baseline, IQR shaded; x-axis in seconds from the clinician's annotated onset. Robustness check with z > 2 for 5 s: shares move ≤ 10 points, medians ≤ 6 s, ordering unchanged. Offline (zero-phase) signal path. Figures: results/expR/figures/.

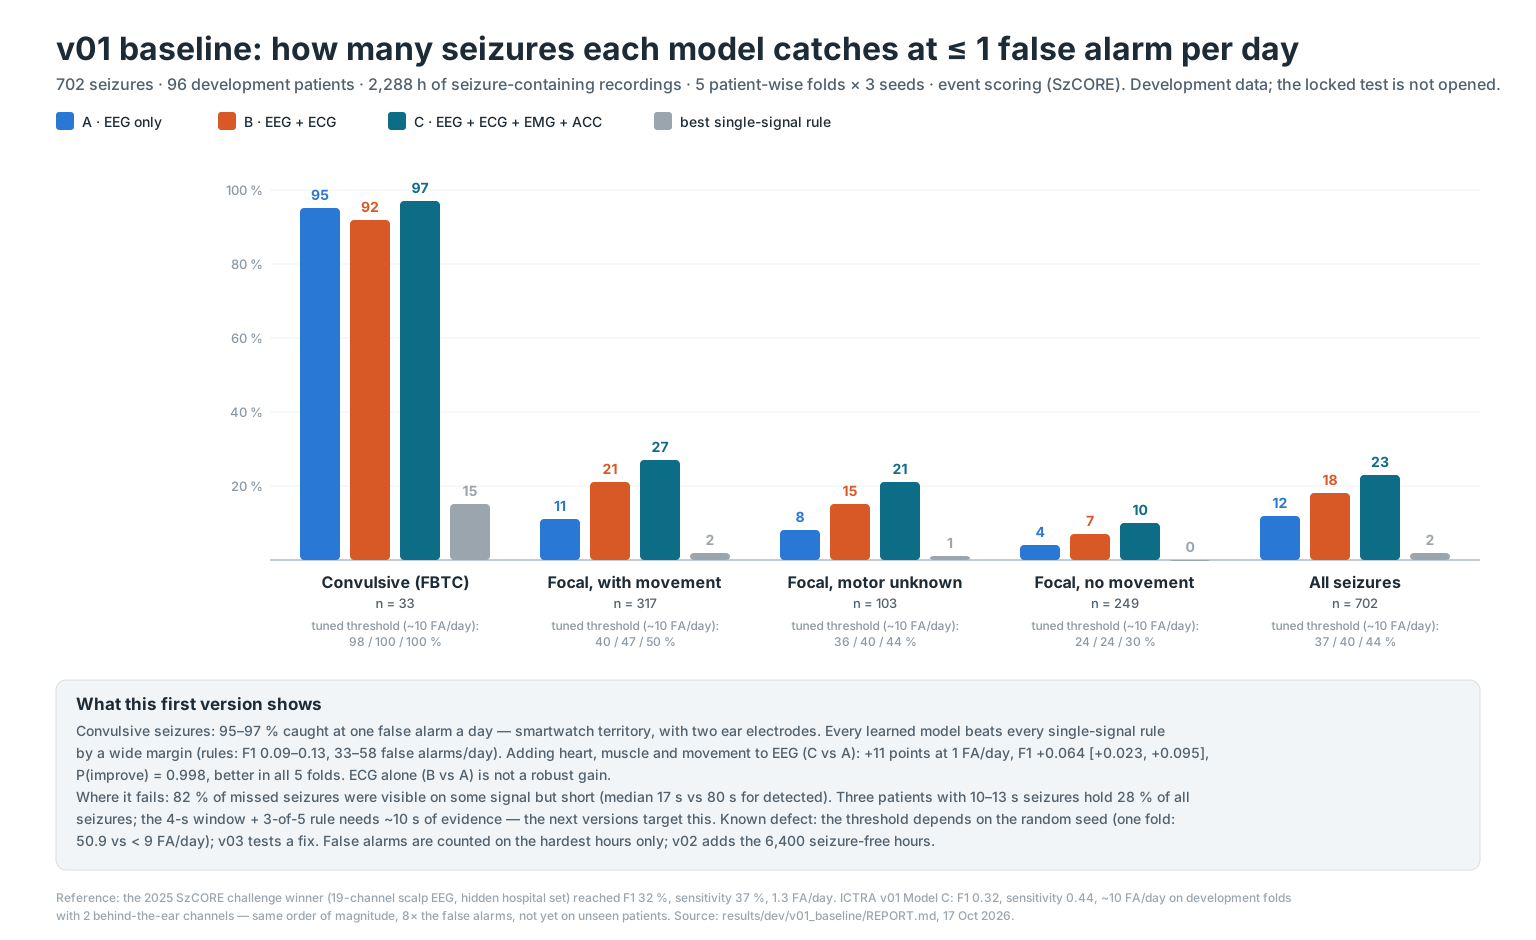
Exhibit 2 · First training run, v01 baseline (delivered 17 Oct 2026) Helena · Model A Tiffany · Model C gain Constance · evaluation

Development folds only (96 patients, 702 seizures, 2,288 h of seizure-containing recordings). Seed-mean over 3 seeds; patient-bootstrap 95 % intervals. Full table: results/dev/v01_baseline/REPORT.md. Not a held-out result. Note (18 Oct): the false-alarm rates in this table were measured on seizure-containing recordings only and understate real-world rates; v02 (all hours) is the realistic baseline — see Exhibit 3.

Model A
EEG
Model B
EEG + ECG
Model C
EEG + ECG + EMG + motion
Best rule
Single-input control
Bar chart: sensitivity at one false alarm per day for Models A, B, C and the best rule, by seizure type. Convulsive 95, 92, 97 and 15 percent; focal with movement 11, 21, 27, 2; focal motor unknown 8, 15, 21, 1; focal without movement 4, 7, 10, 0; all seizures 12, 18, 23, 2.
Read it left to right: the taller the bar, the more seizures caught while keeping false alarms to one a day. Convulsive seizures are nearly all caught by every model. For the other types the teal bar (all four signals) is always the tallest — that is the gain from fusion — but the whole group sits low: these are the seizures a wearable struggles with, and the three short-seizure patients below explain much of it. Open full-size baseline chart ↗

Tuned-threshold results — a different operating point

Not the ≤1 FA/day chart above. Thresholds here were tuned on the inner training split; model rates are approximately 10 false alarms per day. Scope: 702 seizures, 2,288 hours of seizure-containing development recordings only; not the locked test.

modelsensitivityFA / 24 hevent F1 [95 % CI]FBTCfocal motorfocal non-motorunknown motor
A · EEG (xgb)0.3711.10.26 [0.20, 0.37]0.980.400.240.36
B · EEG + ECG (xgb)0.409.60.30 [0.22, 0.43]1.000.470.240.40
C · all four signals (xgb)0.449.70.32 [0.27, 0.47]1.000.500.300.44
C · all four signals (lgbm)0.439.70.321.000.500.280.41
rule_eeg (line length)0.3732.70.130.970.500.150.33
rule_hr (heart-rate rise)0.3957.70.090.730.540.140.46
rule_emg0.3038.30.090.760.430.080.27
rule_acc0.3035.60.100.670.320.160.42

Paired patient bootstrap, fold by fold: C vs A ΔF1 +0.064 [+0.023, +0.095], P(improve) = 0.998, better in all 5 folds → accepted under the §1 rule. B vs A +0.043, P = 0.973 with xgb but 0.785 with lgbm → not robust. Median detection delay 20–22 s from the annotated onset, 9–17 s from the first behind-the-ear EEG change. Sensitivity at the tuned threshold is ~10 FA/day; the bar chart above shows the ≤ 1 FA/day operating point from the sweep.

Reference point: the dataset's own authors, on the same data The full landscape →

KU Leuven's algorithm (behind-the-ear EEG + ECG, trained on SeizeIT1, tested on SeizeIT2: 192 adults, 616 focal seizures, 11,443 h; Swinnen et al., Epilepsia Open 2026) reaches sensitivity 0.73 on its own but at 6.2 false alarms per hour (≈ 149 per day, precision 0.004), so the published system adds a human reviewer: sensitivity 0.31, precision 0.83, F1 0.45, about 8 minutes of review per 24 h of data; FBTCS 0.82, focal impaired-awareness 0.37, focal aware 0.14, frontal onset 0.06. Their algorithm does not use EMG or movement. ICTRA v02 Model C, algorithm only, on all 8,642 development hours: 0.50 at 10 false alarms per day, 0.27 at 1 per day, FBTC 1.00. (v01 reported 0.44 at ≈ 10 per day, but counted false alarms only on recordings that contain a seizure, which flattered the rate.) Caveats that matter: theirs is a true cross-dataset test and ours is development-set cross-validation; the seizure sets and hour bases differ. The comparison becomes fair after our locked and external tests in November.

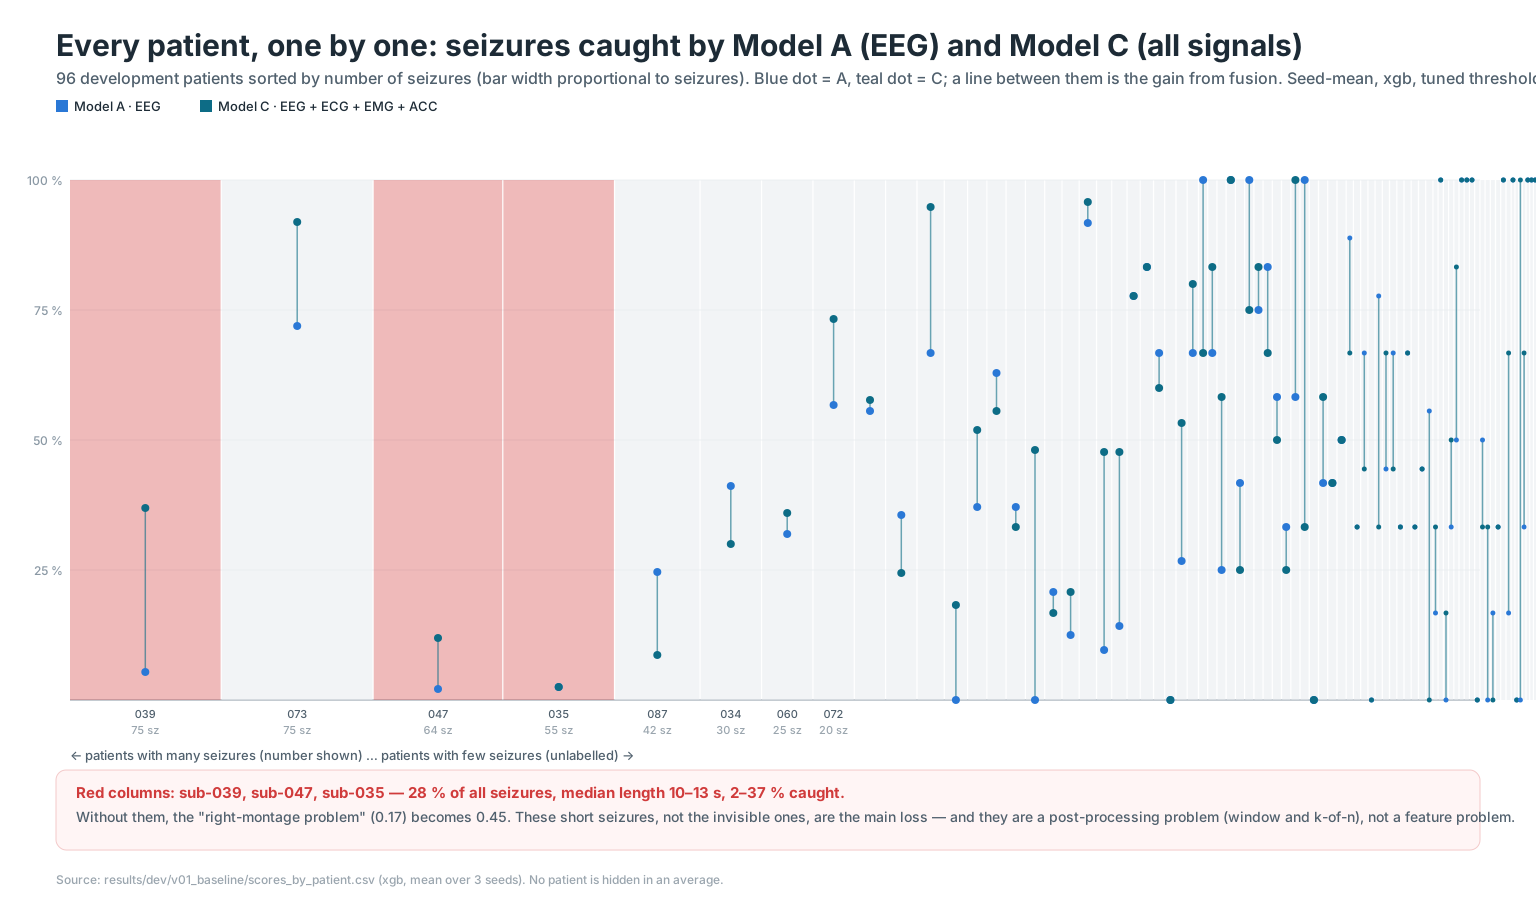
Per-patient sensitivity for Model A and Model C across 96 patients sorted by seizure count; three patients with many short seizures are highlighted with low sensitivity.
No one hidden in an average. Each column is one patient; the teal dot (all signals) is above the blue dot (EEG only) for most of them. The three red columns — sub-039, sub-047, sub-035 — hold 28 % of all seizures, each lasting only 10–13 s, and the models catch 2–37 % of them. Of all missed seizures, 82 % were visible on at least one signal but short (median 17 s); only 16 % were the "invisible" ones from Exp R. The fix is in the decision rule, not the features: v07 (2-s windows) and v08 (2-of-3 voting) are queued.
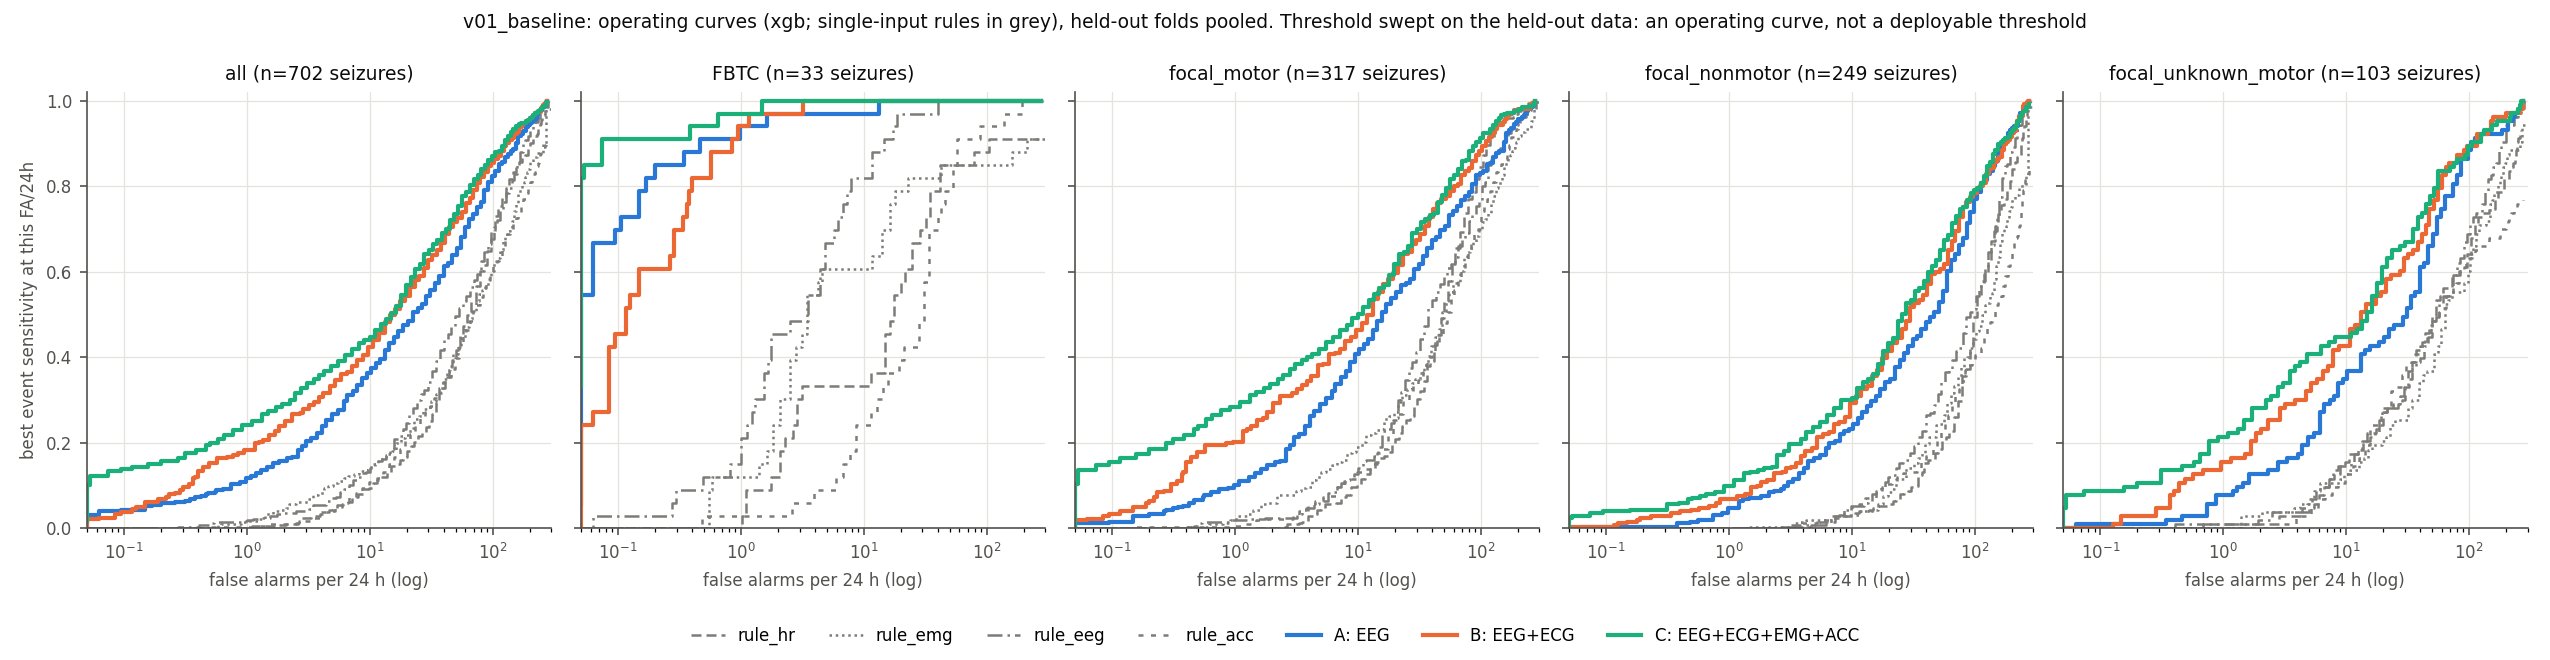
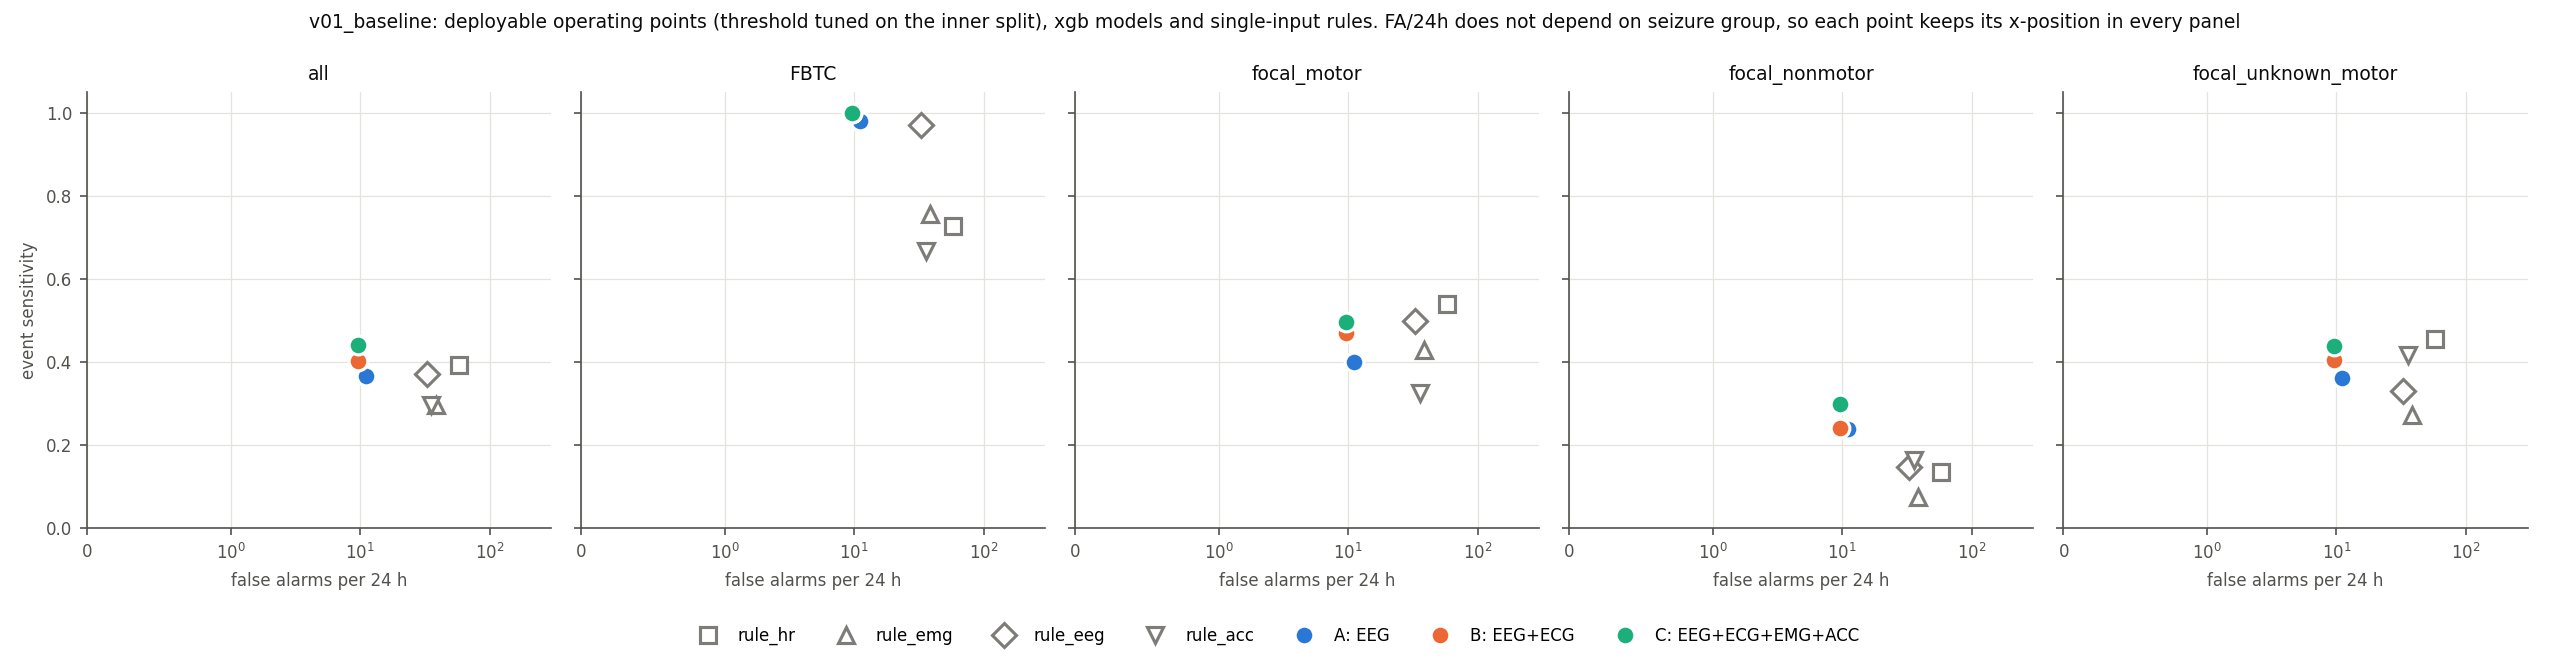
Technical figures: ablation scatter and full operating curves (from the training script)
Operating curves: event sensitivity versus false alarms per 24 h on a log axis, for Models A, B, C and the four rules, pooled and per seizure type
Sensitivity vs false alarms per 24 h (log), held-out folds pooled, threshold swept — an operating curve, not a deployable threshold. C (teal) is above A (blue) everywhere; the rules (grey) need 30–60 FA/day to reach the same sensitivity.
Deployable operating points of A, B, C and the rules per seizure type
The deployable points (threshold tuned on the inner split): every model at ~10 FA/day; rules at 33–58.

Known deviations written in NOTES.md: 3 background bootstrap draws instead of 3 × 5 (fixed from v02); metrics pooled over patients rather than averaged over folds. The alarm threshold varies with the random seed (per-fold τ SD up to 0.052; one seed reached 50.9 FA/day) — v03 tests inner cross-validation for the threshold. GPU: XGBoost on CUDA, 0 fallback warnings; peak RSS 1.59 GB.

Exhibit 3 · How the numbers evolved — every version, accepted or rejected under a rule written in advance Constance · evaluation Helena · thresholds

Updated 18 Oct 2026. The accept rule (§1 of the evaluation protocol, fixed before v01): a new version replaces the reference only if event F1 improves by ≥ 0.01 with P(improve) ≥ 0.90, sensitivity falls by no more than 0.02, and false alarms rise by no more than 0.5 per day. All three must hold. Figures below are Model C (all four signals, XGBoost), development folds.

VersionWhat changedHoursSens.FA/24 hF1Decision
v01
17 Oct
Baseline: 4-s windows, 3-of-5 vote, threshold tuned on one inner split2,288 h
seizure-containing recordings only
0.449.70.32reference
FA understated — see note
v03
18 Oct
Threshold chosen by inner cross-validation (pool predictions, then pick τ) to stop the seed-to-seed swings found in v012,288 h0.38
−0.063 [−0.111, −0.024]
4.5
−5.2 [−6.8, −3.7]
0.38
+0.061 [+0.015, +0.104], P = 0.99
rejected
F1 ✓ FA ✓ sensitivity ✗ (−0.063 > 0.02)
v02
18 Oct
Same method as v01, scored on all development hours, including the ~6,400 seizure-free hours v01 never saw8,642 h0.263.00.19superseded
first run on all hours; its threshold was pinned by the search defect below
v03b
19 Oct
v03’s stable threshold plus a floor: τ may not cost more than 0.02 sensitivity at the same false-alarm budget. Reference is v02, not v01 — same hours, fair comparison. Amendment logged before the run8,642 h0.47
+0.217 [+0.156, +0.274]
7.8
+4.8 [+3.9, +5.8]
0.17
−0.011 [−0.044, +0.026], P = 0.29
rejected
sensitivity ✓ F1 ✗ FA ✗ (+4.8 > 0.5)
v02g
21 Oct
Defect correction, not a new model. The threshold search grid was spaced evenly by percentile; near the top that is wildly uneven in alarm rate, so every run was pinned to the same candidate. Candidates are now spaced by alarm rate. Nothing else changed — same features, same model, same hyperparameters8,642 h0.27
+0.012 [−0.010, +0.036]
1.3
−1.69 [−1.99, −1.41]
0.28
+0.093 [+0.049, +0.140]
new reference
a correction, so it resets the baseline rather than counting as an improvement
What v03b actually showed

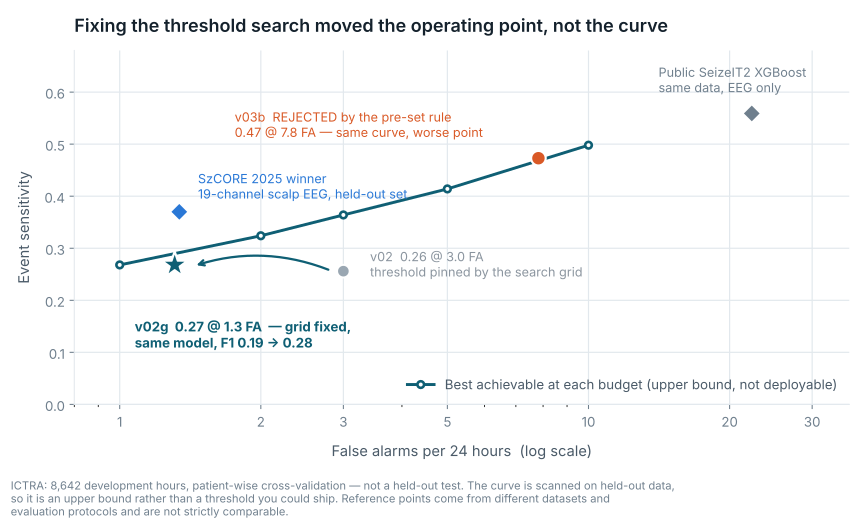
v03b did fix what it was built to fix: the threshold’s seed-to-seed spread fell from about 0.019 to 0.0015. But at every fixed false-alarm budget the two versions sit on the same curve — at 1, 2, 5 and 10 alarms per 24 hours the sensitivities differ by at most 0.013. So v03b is not a worse model. It is the same model with its alarm threshold put in a worse place, and the pre-set rule rejected it for that.

The diagnostic found why, and v02g fixed it: the threshold search was pinned to one grid candidate in every run. Spacing the candidates by alarm rate instead raised event F1 from 0.19 to 0.28 and cut false alarms from 3.0 to 1.3 per day, with no change to the model. The entry under dead ends has the full account.

What is still not fixed. τ still moves between repeats — its spread per fold roughly halved, but across 15 repeats it still ranges from 0.961 to 0.994, and the false-alarm rate those repeats produce ranges from 0.01 to 8.95 per day. The number we report is the mean over repeats; a deployed device would need one threshold, and choosing it reliably is unfinished work.

The causal pipeline, replayed at 6× speed. A bilateral tonic-clonic seizure from the SeizeIT2 development set (sub-070). This patient was in the held-out fold, so the model had never seen them. The four signal lanes and the model’s per-window probability run together; the alarm fires 28 seconds after the annotated onset.

Three things to read carefully. The clip runs at six times real speed, so the 28 seconds pass in about 5 seconds of viewing. The 28 seconds is this one seizure; across the development recordings the median is 34.7 s. And this is a replay of a stored recording, not live acquisition — what makes it meaningful is that every window used only data up to its own end, which is why the timing is real.
Sensitivity against false alarms per 24 hours. ICTRA v02g sits at 0.27 sensitivity and 1.3 false alarms a day; v02 sat at 0.26 and 3.0 before the threshold search was fixed; v03b at 0.47 and 7.8. The SzCORE 2025 winner and a public SeizeIT2 XGBoost implementation are shown for reference.
Every version sits on the same curve. What changed between them is where the alarm threshold landed on it, not how well the model separates seizures from the rest. The curve itself is scanned on held-out development data, so it is an upper bound rather than a threshold that could be shipped. These are development-fold numbers, pooled over all 702 seizures. The locked-test point is not drawn here: it uses the per-patient aggregation the pre-registration specified, and the two cannot be placed on one axis without misleading. Reference points come from other datasets and other evaluation protocols and are not strictly comparable.
Model C (all four signals) read at fixed false-alarm budgets, 8,642 development hours. This is the honest way to compare versions: pick the budget first, then read the sensitivity.
False alarms / 24 hSensitivityEvent F1
10.270.31
20.320.28
30.360.25
50.410.21
100.500.16
What v03 taught us

The stability goal was met — the threshold's seed-to-seed spread shrank from 0.005–0.031 to 0.0002–0.0023, and false alarms halved — but the line settled slightly higher on the same curve and 6 % of seizures fell below it. The rule says that is too many, so v03 was not adopted, even though its F1 is the best we have seen. The fix is not a better model but a better way of choosing where on the curve to sit; that is v03b. Short seizures (< 15 s) lost most: 0.20 → 0.11. Logged in docs/ITERATION_LOG.md, commit 7848a71.

Why v01's false-alarm rate was too kind

v01 scored only the recordings that contain a seizure — about a fifth of the data. Real wearing is mostly quiet hours, and that is where false alarms live. v02 scores every hour, so its false-alarm rate is the one a patient would experience. From v02 onward, every comparison is made at a fixed false-alarm budget (1, 2, 5 and 10 per day): hold the budget equal, then ask which version catches more seizures. Comparing single tuned thresholds across versions, as the first two rows above do, is not fair and we will stop doing it.

Coming after the final run · frames below reserve the exhibits so the layout does not change when numbers land
✓ Three signals, one seizure
delivered — Exhibit 1 above
✓ The headline
v01 delivered — Exhibit 2 above; updated with each accepted version
✓ Per patient
v01 delivered — Exhibit 2 above
✓ How it evolved
v01 → v03 (rejected) → v02 → v03b — Exhibit 3 above
Tests
locked SeizeIT2 patients · Billeci · Siena · szdb · Seer · home wrist data · the gap from development
Honesty
seizures the ear-EEG never shows · flat-signal hours · leakage checklist · feature importances

Pre-registration, hashed and published 26–28 October 2026 (hash and commits), tested once on 28 October (outcomes): (H1) Model C has fewer false alarms per 24 h than Model A at matched sensitivity on convulsive and motor seizures; (H2) adding ECG helps on non-motor focal seizures; (H3a) FBTC is EEG-first; (H3b) in focal seizures ECG adds coverage, not speed. The unsupported original H3 remains in the iteration log below. A version is accepted only if event F1 improves by at least 0.01 with a patient-bootstrap probability of improvement of 0.90 or more, without losing more than 2 points of sensitivity or adding more than 0.5 false alarms per day. Reference points already on this page: ECG-only on SeizeIT2 = 82.8% at 26 FA/h; wearable EEG + EMG on tonic-clonic seizures = 97.7% at 0.4 FA/24 h.

Where ICTRA stands

Every seizure-detection option today trades coverage against convenience. ICTRA sits in the one cell that is still empty: a non-surgical wearable that targets all focal seizure types, with four signals. Numbers are from the cited publications; ICTRA's are development-set results unless marked as locked-test results.

OptionWhat it sensesConvulsive seizuresOther focal seizuresFalse alarmsWhere you can use it
Hospital video-EEG
gold standard
19+ scalp channels, video, clinicianallall—a hospital bed, days at a time; waits of months to a year in BC
Sub-scalp implant
UNEEG SubQ
2 EEG channels under the skinhigh≈ 0.86 reportedlowmonths at home — after surgery
Seizure watch
Empatica Embrace2 (FDA-cleared)
wrist movement + skin conductance≈ 95 % at 0.2 FA/daynot detected — the 94 % of focal seizures without convulsion are invisiblevery lowanywhere
Behind-the-ear EEG wearable
KU Leuven · Sensor Dot, SeizeIT2 study 2026
2 ear-EEG channels + ECG (EMG and motion recorded but not used by the algorithm)0.820.37 impaired-awareness · 0.14 awarealgorithm alone 149/day → needs a human reviewer (8 min per day of data) to reach precision 0.83 at sensitivity 0.31home, days
ICTRA
v01 / v02 interim · development set · 18 Oct 2026
2 ear-EEG + ECG + deltoid EMG + accelerometer, one model0.97–1.00 (0.97 at ≤ 1 FA/day)0.50 with movement · 0.30 without (v01, ~10 FA/day); at a 1–2 FA/day budget overall sensitivity is 0.23–0.24 (v01 C, v02 B interim)algorithm alone, no human in the loop: ≈ 10/day at the v01 threshold on seizure-containing hours; 1.6–2.5/day on all hours (v02 interim); v03b targets ≤ 5 without losing sensitivitydesigned for home; prototype board only so far
What we can say today

Among non-surgical wearables, ICTRA is the only system that models all four signals together and reports results for every focal seizure type. On the shared SeizeIT2 data, its algorithm alone has an order of magnitude fewer false alarms than the dataset authors' published algorithm, and catches more convulsive seizures. At a matched budget of 1–2 false alarms a day, ICTRA's overall sensitivity (0.24, interim) sits about 7 points below the authors' reviewer-assisted figure (0.31) and 13 below the best 19-channel scalp-EEG algorithm (SzCORE 2025 winner, 0.37 at 1.3 FA/day) — the first gap is within statistical noise, the second is mostly electrode count.

What we do not say yet

That it beats the seizure watch on convulsive seizures (parity on the development set; the watch is FDA-cleared and validated prospectively), or that it beats anyone on unseen patients. Those claims wait for the locked 29 patients and the external datasets in November — and the numbers will be published whichever way they fall.

Sources: Swinnen et al. 2026 Epilepsia Open (SeizeIT2 validation); Onorati et al. 2017 Epilepsia (Embrace); sub-scalp figure as cited in Swinnen 2026 (Remvig et al.); SzCORE 2025 for scalp-EEG algorithms; ICTRA results/dev/v01_baseline/REPORT.md. Full v01 table →

Dead ends and negative results, kept on purpose Constance · honesty layer

A result that goes against us is still a result. Everything below was tried, measured and written down before it was set aside; nothing here was deleted from the record.

Prediction instead of detection — considered, declined

Tried: a literature check (17 Oct 2026) on forecasting seizures minutes ahead from wearable signals. Found: the strongest study (Nasseri & Stirling, Epilepsia 2025: 11 patients, ~337 days of smartwatch data each, implanted EEG as ground truth) reaches AUC 0.74–0.78 with 6–8 hours per day in a warning state, after 2–3 months of per-patient training; HRV-based prediction (72-study review, 2024) is patient-specific and retrospective, with changes mostly inside the last 5 minutes; the only out-of-sample ECG test we found (Siena, 6 patients) fell to 70 % sensitivity at 3.4 false alarms per hour. SeizeIT2 (2–5 day stays, de-identified clocks) cannot test such a claim. Decision: stay with detection; call the seconds-level heart-rate lead what it is — early detection. Why detection, not prediction →

Exp P · pre-ictal drift in the last two minutes — tested, nothing found

Question: do heart rate, HRV, muscle or movement drift in the −120…−30 s before onset compared with −300…−120 s? Design: 538 development seizures (93 patients) with ≥ 10 min of clean recording before onset, each paired with 10 pseudo-onsets drawn from seizure-free parts of the same patient's recordings (5,350 controls). A signal counts as drifting only if the share of seizures with a z > 2 change exceeds the control share with a patient-bootstrap interval that excludes zero. Registered as exploratory before the run. Result (17 Oct 2026): 0 of 20 cells (4 signals × 5 groups) pass; 0 of 20 again with a −60…−30 s window. Median drift z is −0.13 to +0.08 for seizures — the same as for controls. Falling values are equally absent. The seizure and control curves overlap until about −20 s; the rise after that is the seizure starting around the annotated onset, which is what Exp R measured. Decision: a warning minutes ahead is not plausible from these four signals; ICTRA stays a detection system. Not ruled out: slow changes over 10–60 min, scalp-EEG precursors, clinical R-R HRV, and sleep/wake effects (the controls could not be matched for vigilance). results/expP/FINDINGS.md

Hypothesis H3 as first written — not supported

"EEG changes before heart rate in most seizures." On the development set the behind-the-ear EEG was strictly first in only 41–56 % of seizures by type (FBTC 54 %, focal motor 45 %, non-motor 41 %, unknown 56 %). Rewritten before pre-registration into two predictions the data can actually test on the locked set: H3a, FBTC is EEG-first; H3b, in focal seizures ECG adds coverage, not speed. The original wording stays in the iteration log. Outcome on the locked set: H3b held; H3a did not — the rewritten, narrower version of the claim failed too, on patients chosen in advance to judge it.

A ≥ 70 % threshold for H3b — rejected as circular

A first draft of H3b set a 70 % threshold for "heart rate within ±10 s of the EEG change". The development set gives 57 %, so the threshold would have been chosen by looking at the answer. Replaced with a model-level prediction (B's delay not shorter than A's by more than 2 s, B's sensitivity higher).

Seed-dependent decision threshold — found in v01, explained in v03b, fixed in v02g

The symptom (v01): one Model A fold produced 50.9 false alarms per 24 h on one seed while its two siblings stayed under 9. Model C did the same, with τ at 0.915 on one seed and 0.976 on another.

Two attempts that did not fix it: v03 chose τ by inner cross-validation, and v03b added a sensitivity floor. Both stabilised τ and both were rejected by the accept rule, because a stable threshold in the wrong place is still the wrong place.

The cause (found in the v03b diagnostic): the search tried 40 candidate thresholds spaced evenly between the 90th and 99.99th percentile of the model’s scores. Even spacing by percentile is very uneven in alarm rate — the last two candidates fire on 0.27 % and 0.01 % of windows, a 27-fold gap with nothing between them. All thirty learned-model runs picked the same candidate. The operating point was not being chosen from the data; it was pinned by the grid.

The fix (v02g): space the candidates by alarm rate instead. No change to the features, the model or its settings. Event F1 went from 0.19 to 0.28 and false alarms fell from 3.0 to 1.3 per day. The same grid had been in use since v01, so three earlier versions were reading their results from a point the search could not leave.

v03 · stable threshold — worked, rejected anyway

Tried: choosing the alarm threshold by inner cross-validation so it stops depending on the random seed. Found (18 Oct 2026): it worked — threshold spread fell 10×, false alarms halved (9.7 → 4.5/day), F1 rose 0.32 → 0.38. But sensitivity fell 0.44 → 0.38, three times more than the 0.02 the accept rule allows. Decision: rejected under §1 as written; the better F1 did not override the rule. Carried into v03b with a sensitivity floor. Exhibit 3 →

Datasets we did not use, and why

Three Kaggle "EMG seizure" datasets: one is a 126 GB verbatim re-upload of SeizeIT2 without attribution (and with someone's API key inside), one is an undocumented dump of five SeizeIT2 subjects, one generates random numbers in a notebook and scores 50 %. SeizeIT1 is no longer shared (ethics approval expired). EEGMMIDB, HBN and Bonn as "healthy negatives" were dropped because a model would learn which dataset a window came from, not whether it holds a seizure. A proposed sub-001…030 / 031…042 split was rejected because two patients held 130 of the 187 "test" seizures.

Numbers we will not report

Accuracy, specificity and false alarms per hour. On data where seizures are under 1 % of the time, accuracy is near 99 % for a model that never fires; FA per hour hides a device that cries wolf 24 times a day. Every table uses event sensitivity, FA per 24 h, delay and F1, by seizure type, with patient-bootstrap intervals.

Supporting literature

The problem is current, local and documented. These are the reports and studies the team built the case on.

World Health Organization2024
50 Mworldwide

Epilepsy fact sheet

Around 50 million people have epilepsy; nearly 80% live in low- and middle-income countries, and about three quarters of patients in low-income countries may not get the treatment they need. Risk of premature death is up to three times higher.

Read the fact sheet ↗
CBC News · British Columbia2024
SUDEPno autopsy

A sudden death, and no answers

A BC man with epilepsy died suddenly; the coroner declined an autopsy, leaving his family without an explanation. Unwitnessed seizures leave no record of what happened.

Read the story ↗
CBC News · British ColumbiaVideo
18months waiting

A mother on the wait-list

A BC mother waited a year and a half for an epilepsy procedure, unable to safely care for her own children because seizures came without warning.

Watch ↗
KU Leuven · SeizeIT2Feb 2025
11,626 h125 patients

Largest public wearable seizure dataset released

Behind-the-ear EEG, ECG, EMG and movement recorded from 125 patients across five European epilepsy centres, with 883 annotated seizures in the released files (the paper says 886), published on OpenNeuro under CC0. ICTRA trains on it, and on nothing else.

Read the paper ↗
Sensors (MDPI)Dec 2025
26false alarms / hour

ECG alone is not enough

On SeizeIT2, the best ECG-only detector reached 82.8% sensitivity but 26 false alarms per hour. The authors call false-alarm rates "substantially above clinically acceptable thresholds". This is the gap fusion closes.

Read the study ↗
Wearable seizure detection review2025
0.4FA / 24 h with EEG + EMG

Multimodal wearables cut false alarms

Two-channel behind-the-ear EEG alone: 100% sensitivity, 10.3 false alarms per day. Add EMG: 97.7% sensitivity, 0.4 per day. Add movement: 0.1 per day. Evidence that combining signals works.

Read the review ↗
Seizure (journal)2014
~80%of focal seizures

The heart reacts, often before the EEG

Ictal tachycardia, a sharp heart-rate rise, occurs in roughly 80% of focal seizures and in a subset starts seconds before the EEG onset, especially in temporal lobe epilepsy.

Read the review ↗
Epilepsy FoundationPipeline update
2signals in a smartwatch

What today's seizure watches measure

Consumer devices track movement and heart rate. They help with convulsive seizures, but non-motor seizures are invisible to them and false alarms are common.

Read the update ↗
Epileptic spasm guidelines2026
27 / 28guidelines recommend EEG

EEG is the standard, and the bottleneck

A 2026 comparison of international guidelines for infantile epileptic spasms found EEG recommended in 27 of 28. Delayed diagnosis harms neurodevelopment, and EEG access is the limiting step.

Read the article ↗

References

World Health Organization (2024). Epilepsy fact sheet. who.int

Hoppe, C., Poepel, A., & Elger, C. E. (2007). Epilepsy: Accuracy of patient seizure counts. Archives of Neurology, 64(11), 1595–1599.

Langan, Y., Nashef, L., & Sander, J. W. (2005). Case-control study of SUDEP. Neurology, 64(7), 1131–1133.

Eggleston, K. S., Olin, B. D., & Fisher, R. S. (2014). Ictal tachycardia: The head–heart connection. Seizure, 23(7), 496–505.

Witness recognition of focal and generalized seizures (2025). Epilepsia. doi:10.1111/epi.18499

Bhagubai, M., et al. (2025). SeizeIT2: Wearable dataset of patients with focal epilepsy. arXiv:2502.01224. Dataset: OpenNeuro ds005873.

Reintjes, C., et al. (2025). ECG-based detection of epileptic seizures in real-world wearable settings: Insights from the SeizeIT2 dataset. Sensors, 25(24), 7687.

Dan, J., et al. (2024). SzCORE: Seizure community open-source research evaluation framework. Epilepsia. doi:10.1111/epi.18113 · Dan, J., et al. (2025). SzCORE / AI-Epilepsy seizure detection challenge results. arXiv:2505.18191

Review of multimodal wearable seizure detection (2025). PMC11818620. · Multimodal wearable EEG, EMG and accelerometry for tonic-clonic seizure detection on SeizeIT2. arXiv:2403.13066

Epileptic spasm recognition and guideline comparison (2026). PMC12729157.

Shoeb, A. (2009). CHB-MIT Scalp EEG Database. PhysioNet. · Detti, P. (2020). Siena Scalp EEG Database. PhysioNet. · Billeci, L., et al. (2018). EEG-ECG epilepsy dataset. Zenodo 1415495. · Al-Aweel, I., et al. Post-ictal heart rate oscillations (szdb). PhysioNet. · Arbune, A. A., et al. (2020). Ictal surface EMG and PGES. Zenodo 3885755 / Dryad. · Epilepsy Ecosystem. My Seizure Gauge wearable data. · OpenSeizureDetector. Open Seizure Database v1.0.0.

CBC News (2024). Epileptic man's sudden death, no autopsy. · CBC News. Mother waited a year and a half for epilepsy procedure [video].

Epilepsy Foundation. Smartwatches for seizure detection: therapies pipeline update.

Zhou, A. (2026). BioSignal Studio [source code]. GitHub: AICAllenZhou/biosignal-studio.
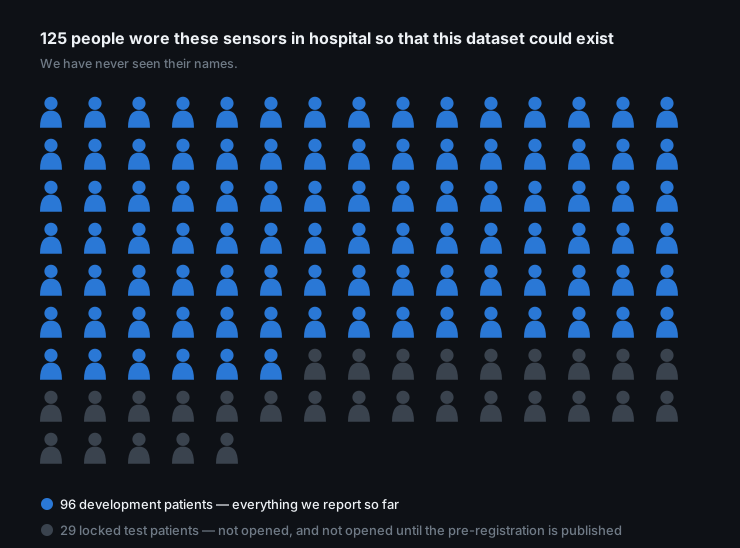
Image credits, licences and illustration provenance

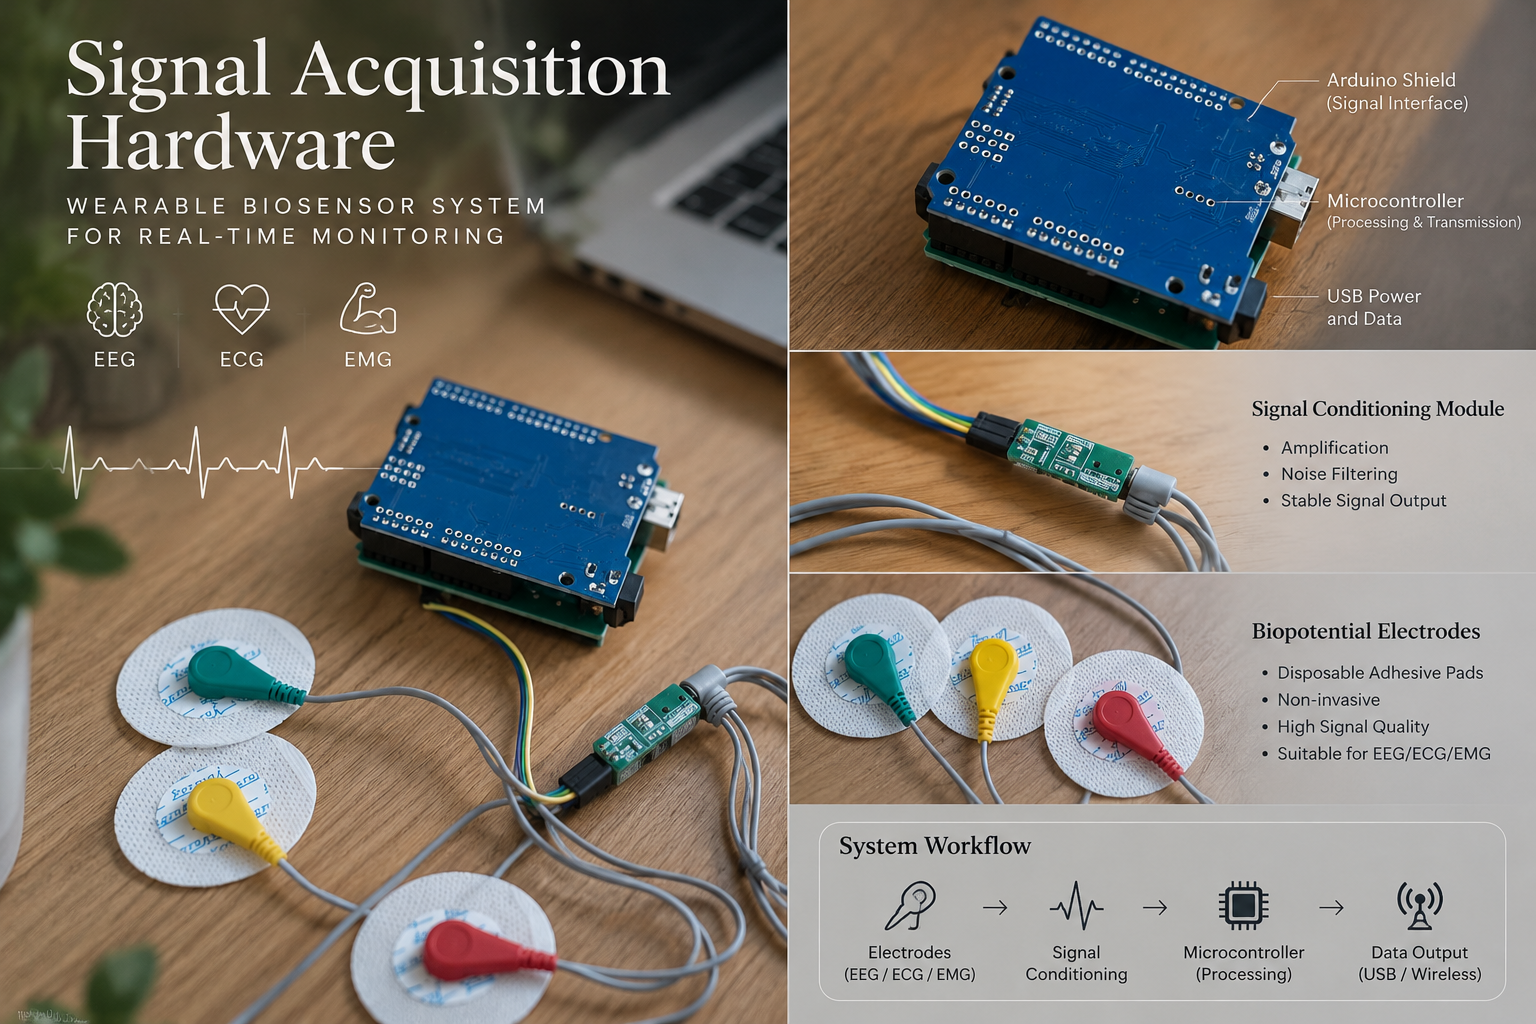
Supplied hardware reference

The owner-supplied hardware illustration is retained in Engineering’s “Supplied conceptual hardware overview” disclosure. It is not the current homepage hero, a verified photograph of the assembled prototype, an approved wiring diagram or experimental evidence. No redistribution licence is asserted for this supplied material.

View the original supplied illustration

Concept renders (AI-generated)

Eleven AI-generated concept images are currently displayed across five pages. They illustrate future product form, research context and proposed use—not real ICTRA hardware, team members, patients, clinical activity or experimental evidence. Each is labelled where it appears.

  • Overview: P1, wearable design concept.
  • Problem: P2, bedroom; P9, waiting room; P12, sleeping with a proposed ear patch.
  • AI & Method: P3, sensor-patch concept.
  • Engineering: P4, bench-kit direction; P6, electrode detail; P8, bedside hub; P10, patch, hub and phone.
  • Ethics: P7, patch removal; P11, proposed clinician review.

The earlier P13 soldering scene has been withdrawn from Team. Generation prompts are retained in CHATGPT_IMAGE_PROMPTS.md and the existing generation records. The SeizeIT2 source images and real training screenshots are credited separately and are not concept renders.

Photography credits

External photographs provide research context. They do not depict ICTRA participants, validate the prototype or imply endorsement by the photographers or people pictured.

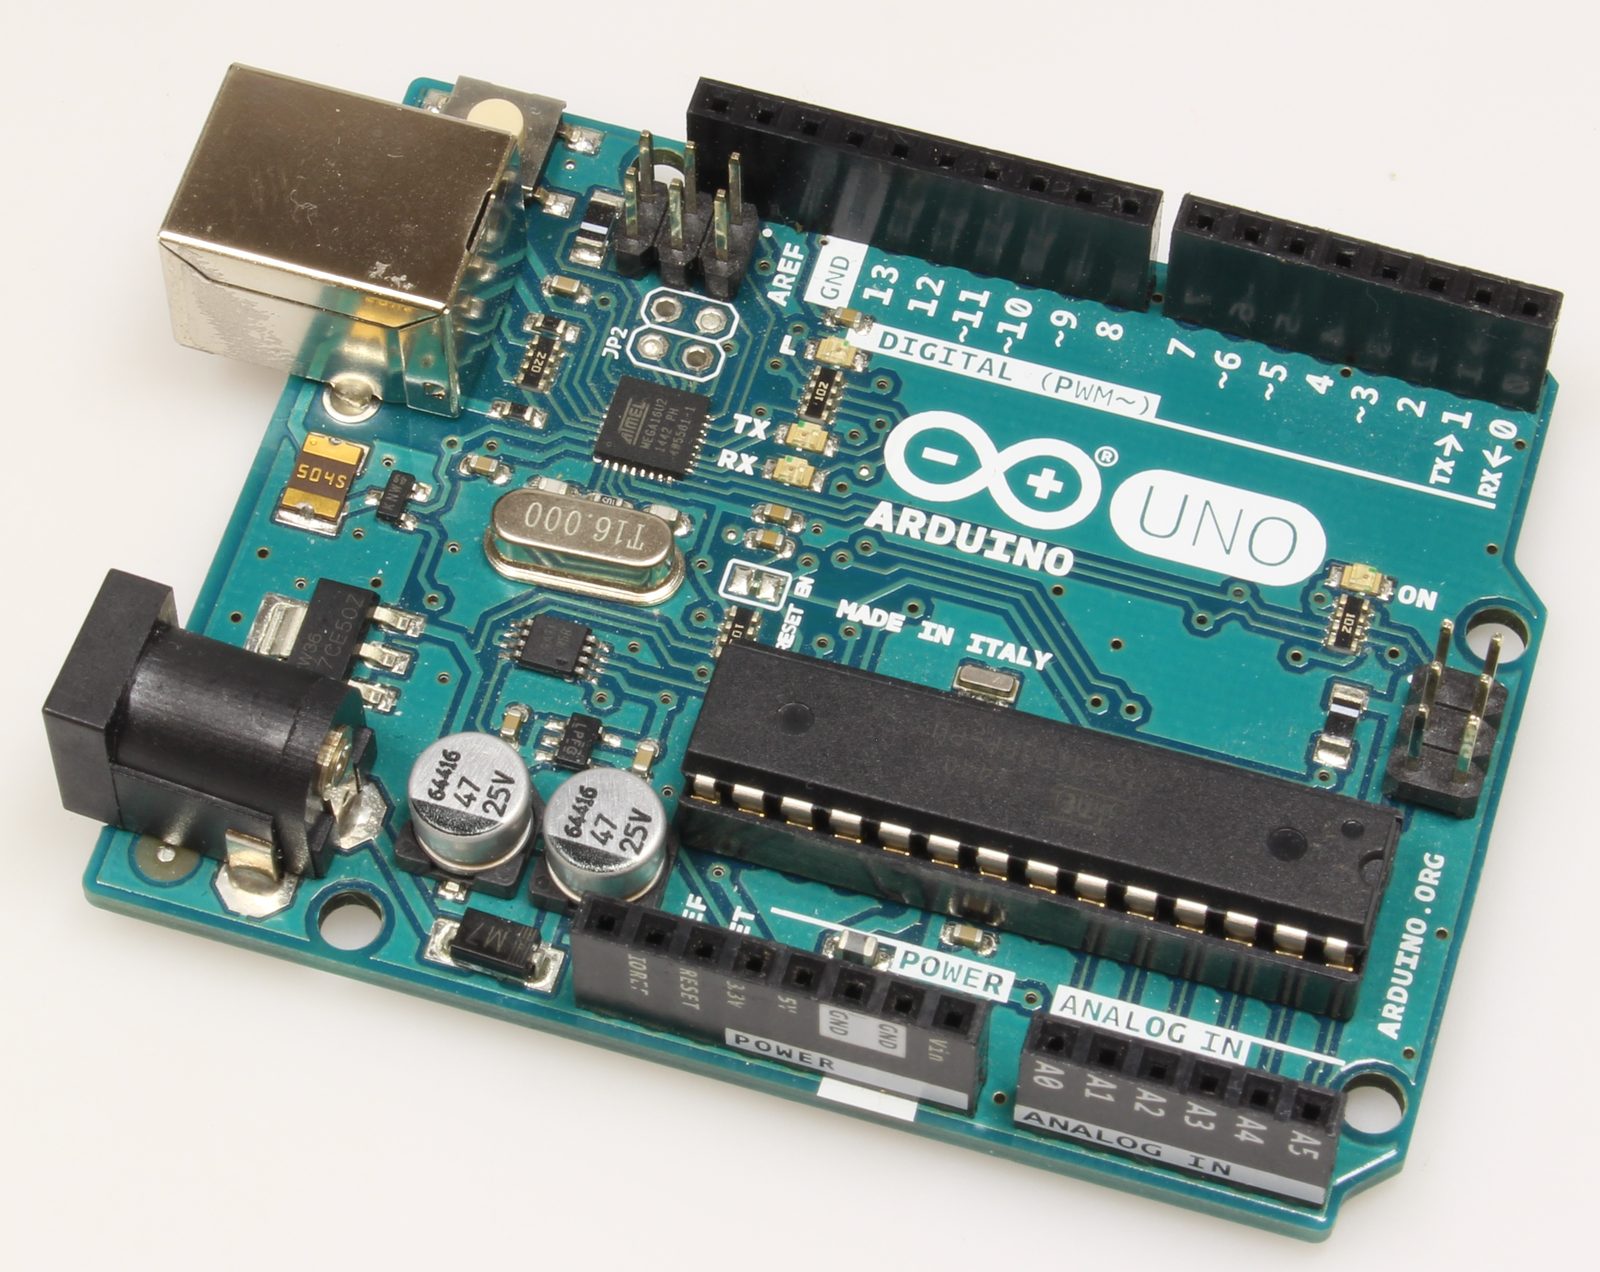
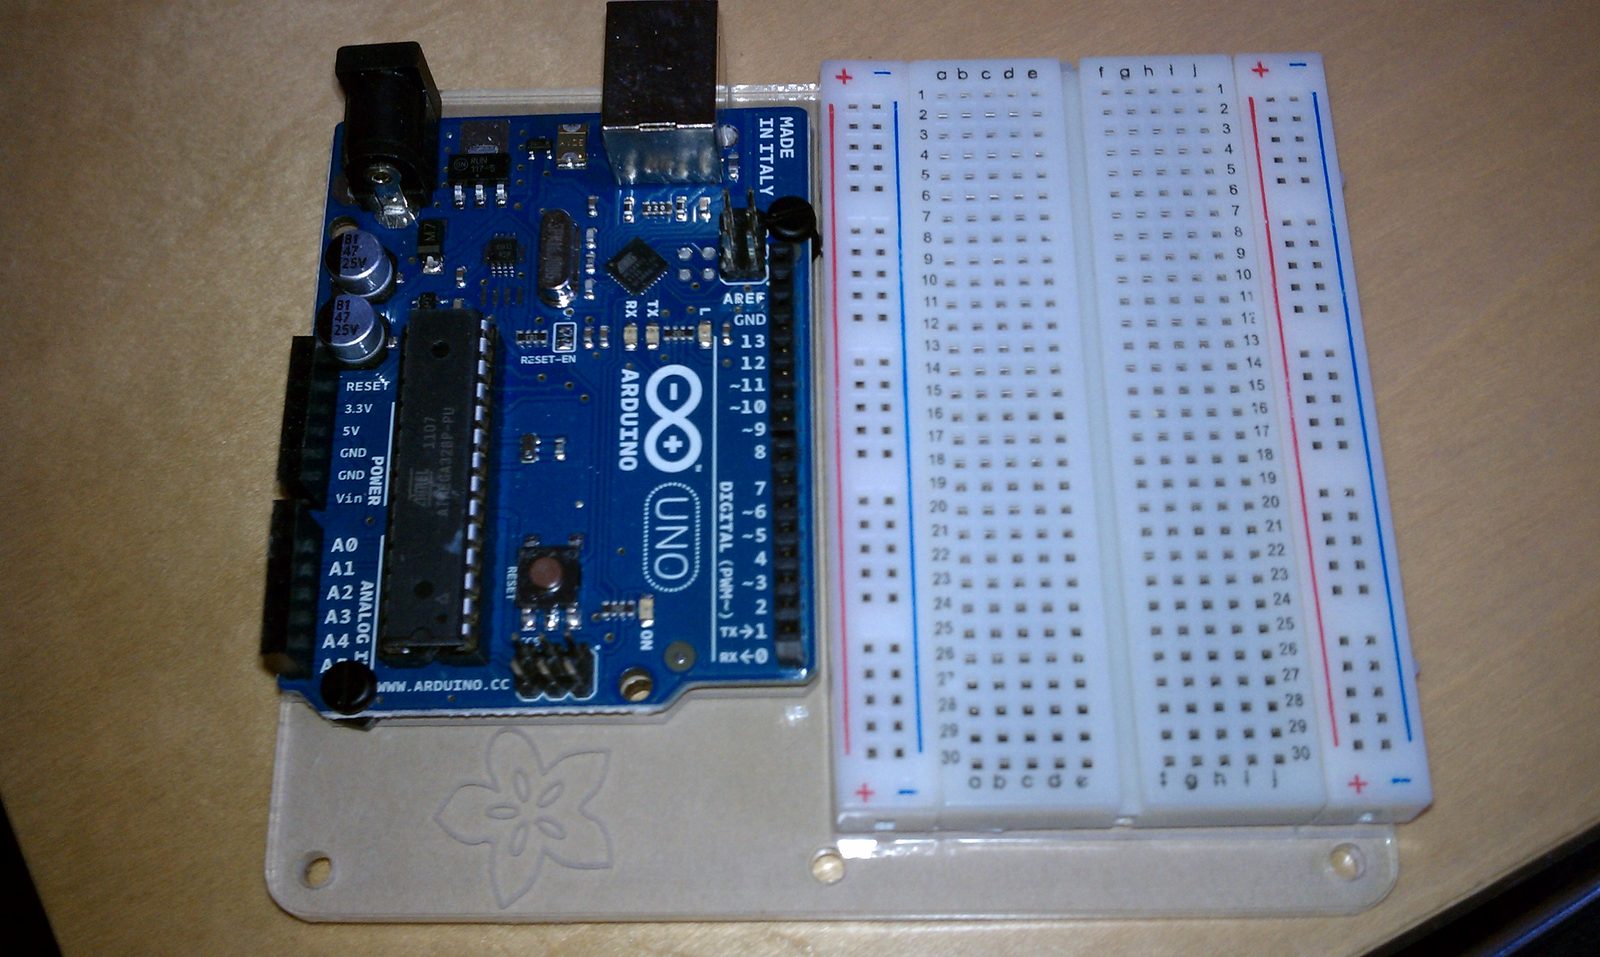
Arduino Uno R3 photograph

Arduino Uno R3

MakeMagazinDE · 5 April 2018

Wikimedia Commons source · CC BY-SA 4.0

Unmodified photograph, displayed at responsive sizes. The photograph remains available under CC BY-SA 4.0. The board is a component reference, not the complete project acquisition system.

Project-supplied material

The three implementation screenshots were preserved from the original project HTML. The conceptual hardware overview was supplied as a visual reference; it is identified as an illustration, not an original hardware photograph. No license for redistribution of these project-supplied assets is asserted here.

Additional photography sources

All photographs below retain their indicated licenses. No endorsement or project participation is implied. Photographs of people are used only as neutral research context; personality rights may apply.

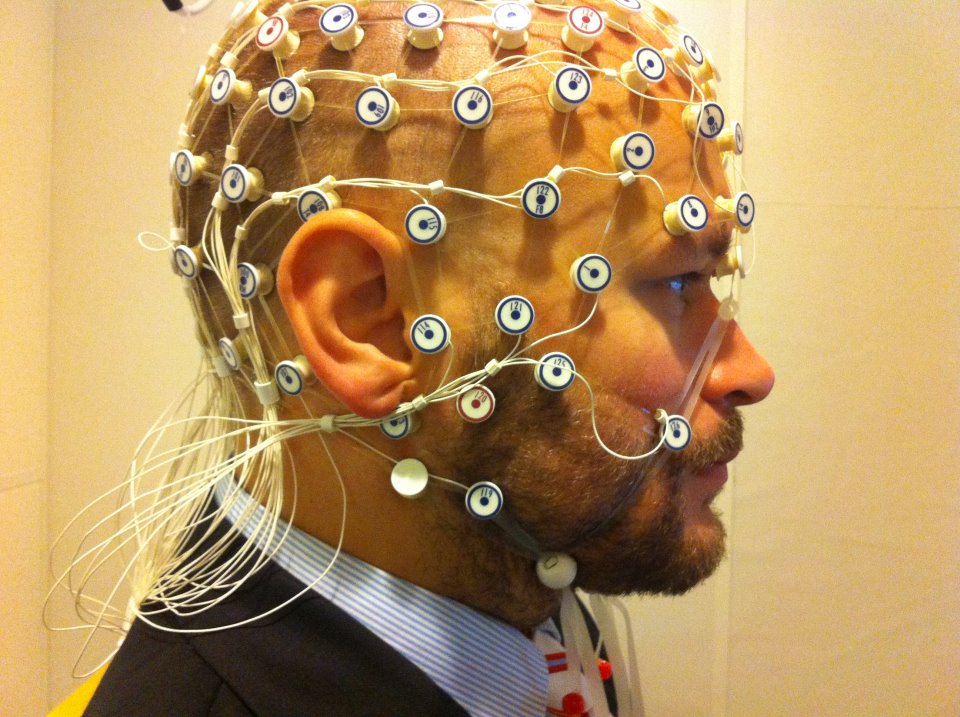
Participant wearing an EEG electrode cap at a phonetics laboratory

EEG recording

Petter Kallioinen

Original source · CC BY-SA 3.0

Original Commons image, unchanged; responsive display only.

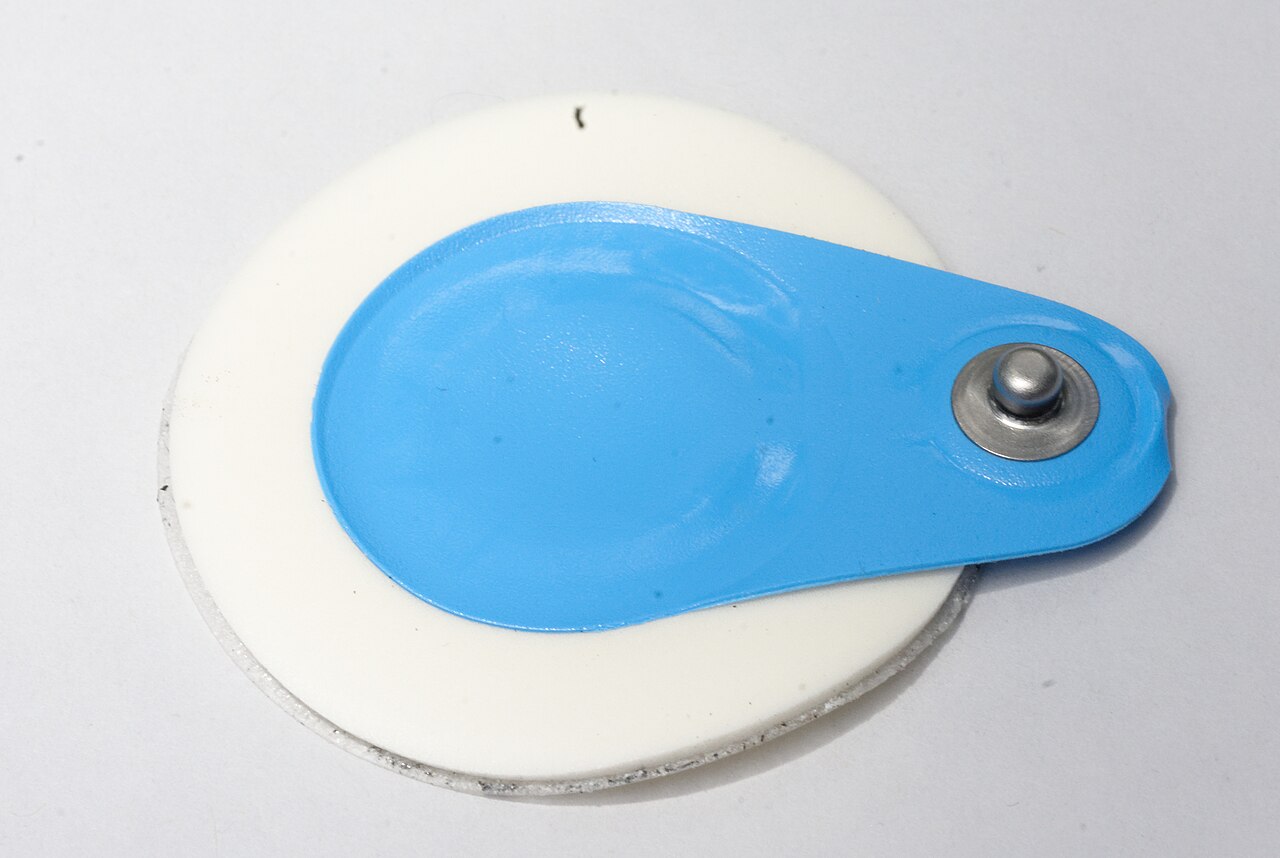
Close-up of a blue and white ECG electrode with a metal snap connector

EKG sensor

Jud McCranie

Original source · CC BY-SA 4.0

Commons-provided 1280-pixel thumbnail. Resized by the source; no additional image edits.

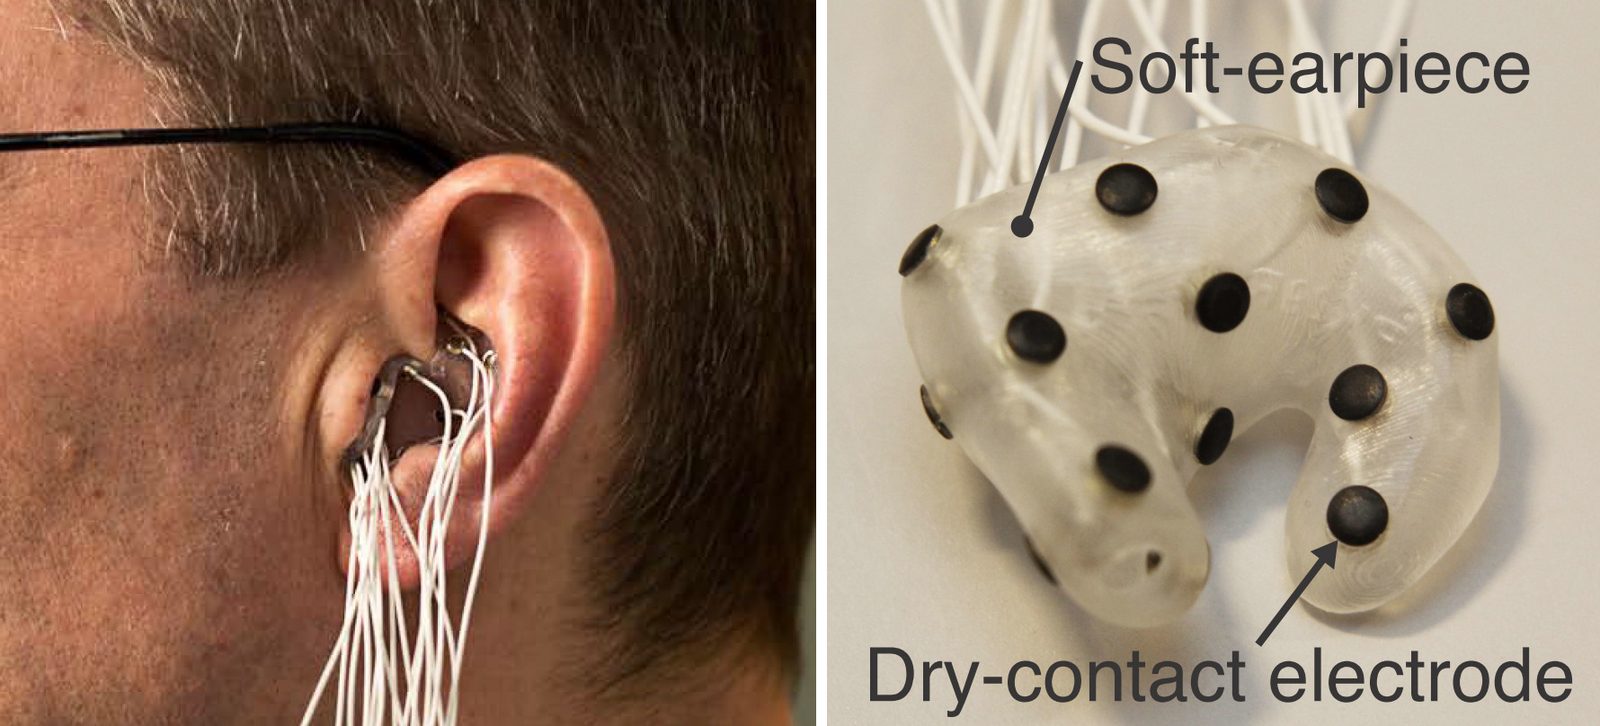
Two photographs showing an in-ear EEG earpiece being worn and its dry-contact electrodes

High-density Ear-EEG

Simon L. Kappel

Original source · CC BY-SA 4.0

Original annotated photographic composite from Commons, unchanged; responsive display only. CC BY-SA 4.0 selected from the offered licenses.

An Arduino Uno and an empty solderless breadboard mounted together on a base

Arduino & breadboard, mounted

TreyDanger

Original source · CC BY 2.0

Original Commons image, unchanged; responsive display only.

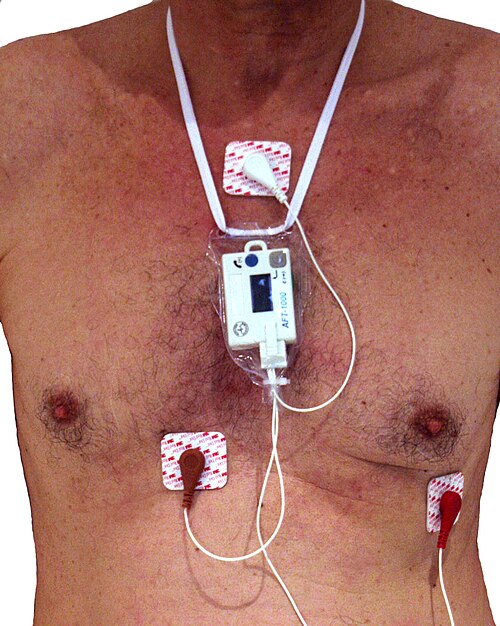
A person wearing a small Holter ECG recorder with three connected adhesive electrodes

HolterAFT1000

Faisandier

Original source · CC BY-SA 3.0

Commons-provided 500-pixel thumbnail. Resized by the source; no additional image edits. CC BY-SA 3.0 selected from the offered licenses.

Method diagrams

The four method diagrams (training workflow, model comparison, patient split and three evidence tiers) are vector schematics drawn on 17 October 2026 directly from the project code and protocol: src/ictra_lib.py, src/04_train_ablation.py, data/catalog/splits.json and docs/EVALUATION_PROTOCOL.md. Every parameter shown (4-s windows, 2-s hop, 1–25 Hz, 3-of-5 rule, 96 / 29 patients, 5 folds, feature families) is the one in the code. They replaced earlier AI-generated pictures whose fold counts, hardware and feature labels did not match the pipeline.

Waveforms and table values inside the diagrams are illustrative; the steps, counts and names are not. They are explanations, not training logs, raw recordings, fitted-tree visualizations or evidence of model performance.

SeizeIT2 recording-setup sources

The Engineering page links to the original Byteflies manufacturer photograph and displays the complete Figure 1 from Swinnen et al. (2026). The manufacturer photograph is a product demonstration, not a study-participant photograph; it is linked at its original source rather than redistributed because republication permission has not been confirmed. The displayed paper figure is an unchanged published schematic, not a photograph.

Swinnen et al., The SeizeIT2 study, Figure 1. Copyright 2026 the authors; CC BY-NC-ND 4.0. Byteflies retains rights to its manufacturer photograph; the source manifest records its reference-only publication status. Source and provenance manifest.

The setup uses two Sensor Dots: one on the upper back/neck for behind-ear EEG; one on the left chest for ECG and deltoid EMG. Movement sensors are built in. Native acquisition rates (250 Hz biopotentials, 25 Hz movement) are distinct from ICTRA processing at 256 Hz.